Details of
UR Pedersen, AK Bacher, TB Schrøder, JC DyreThe EXP pair-potential system. III. Thermodynamic phase diagram,
The Journal of Chemical Physics, 150:174501,2019.
The dataset contains the following parts/files:
Readme file
Pyton script for generating figures
Lattice energy as function of density at T=0
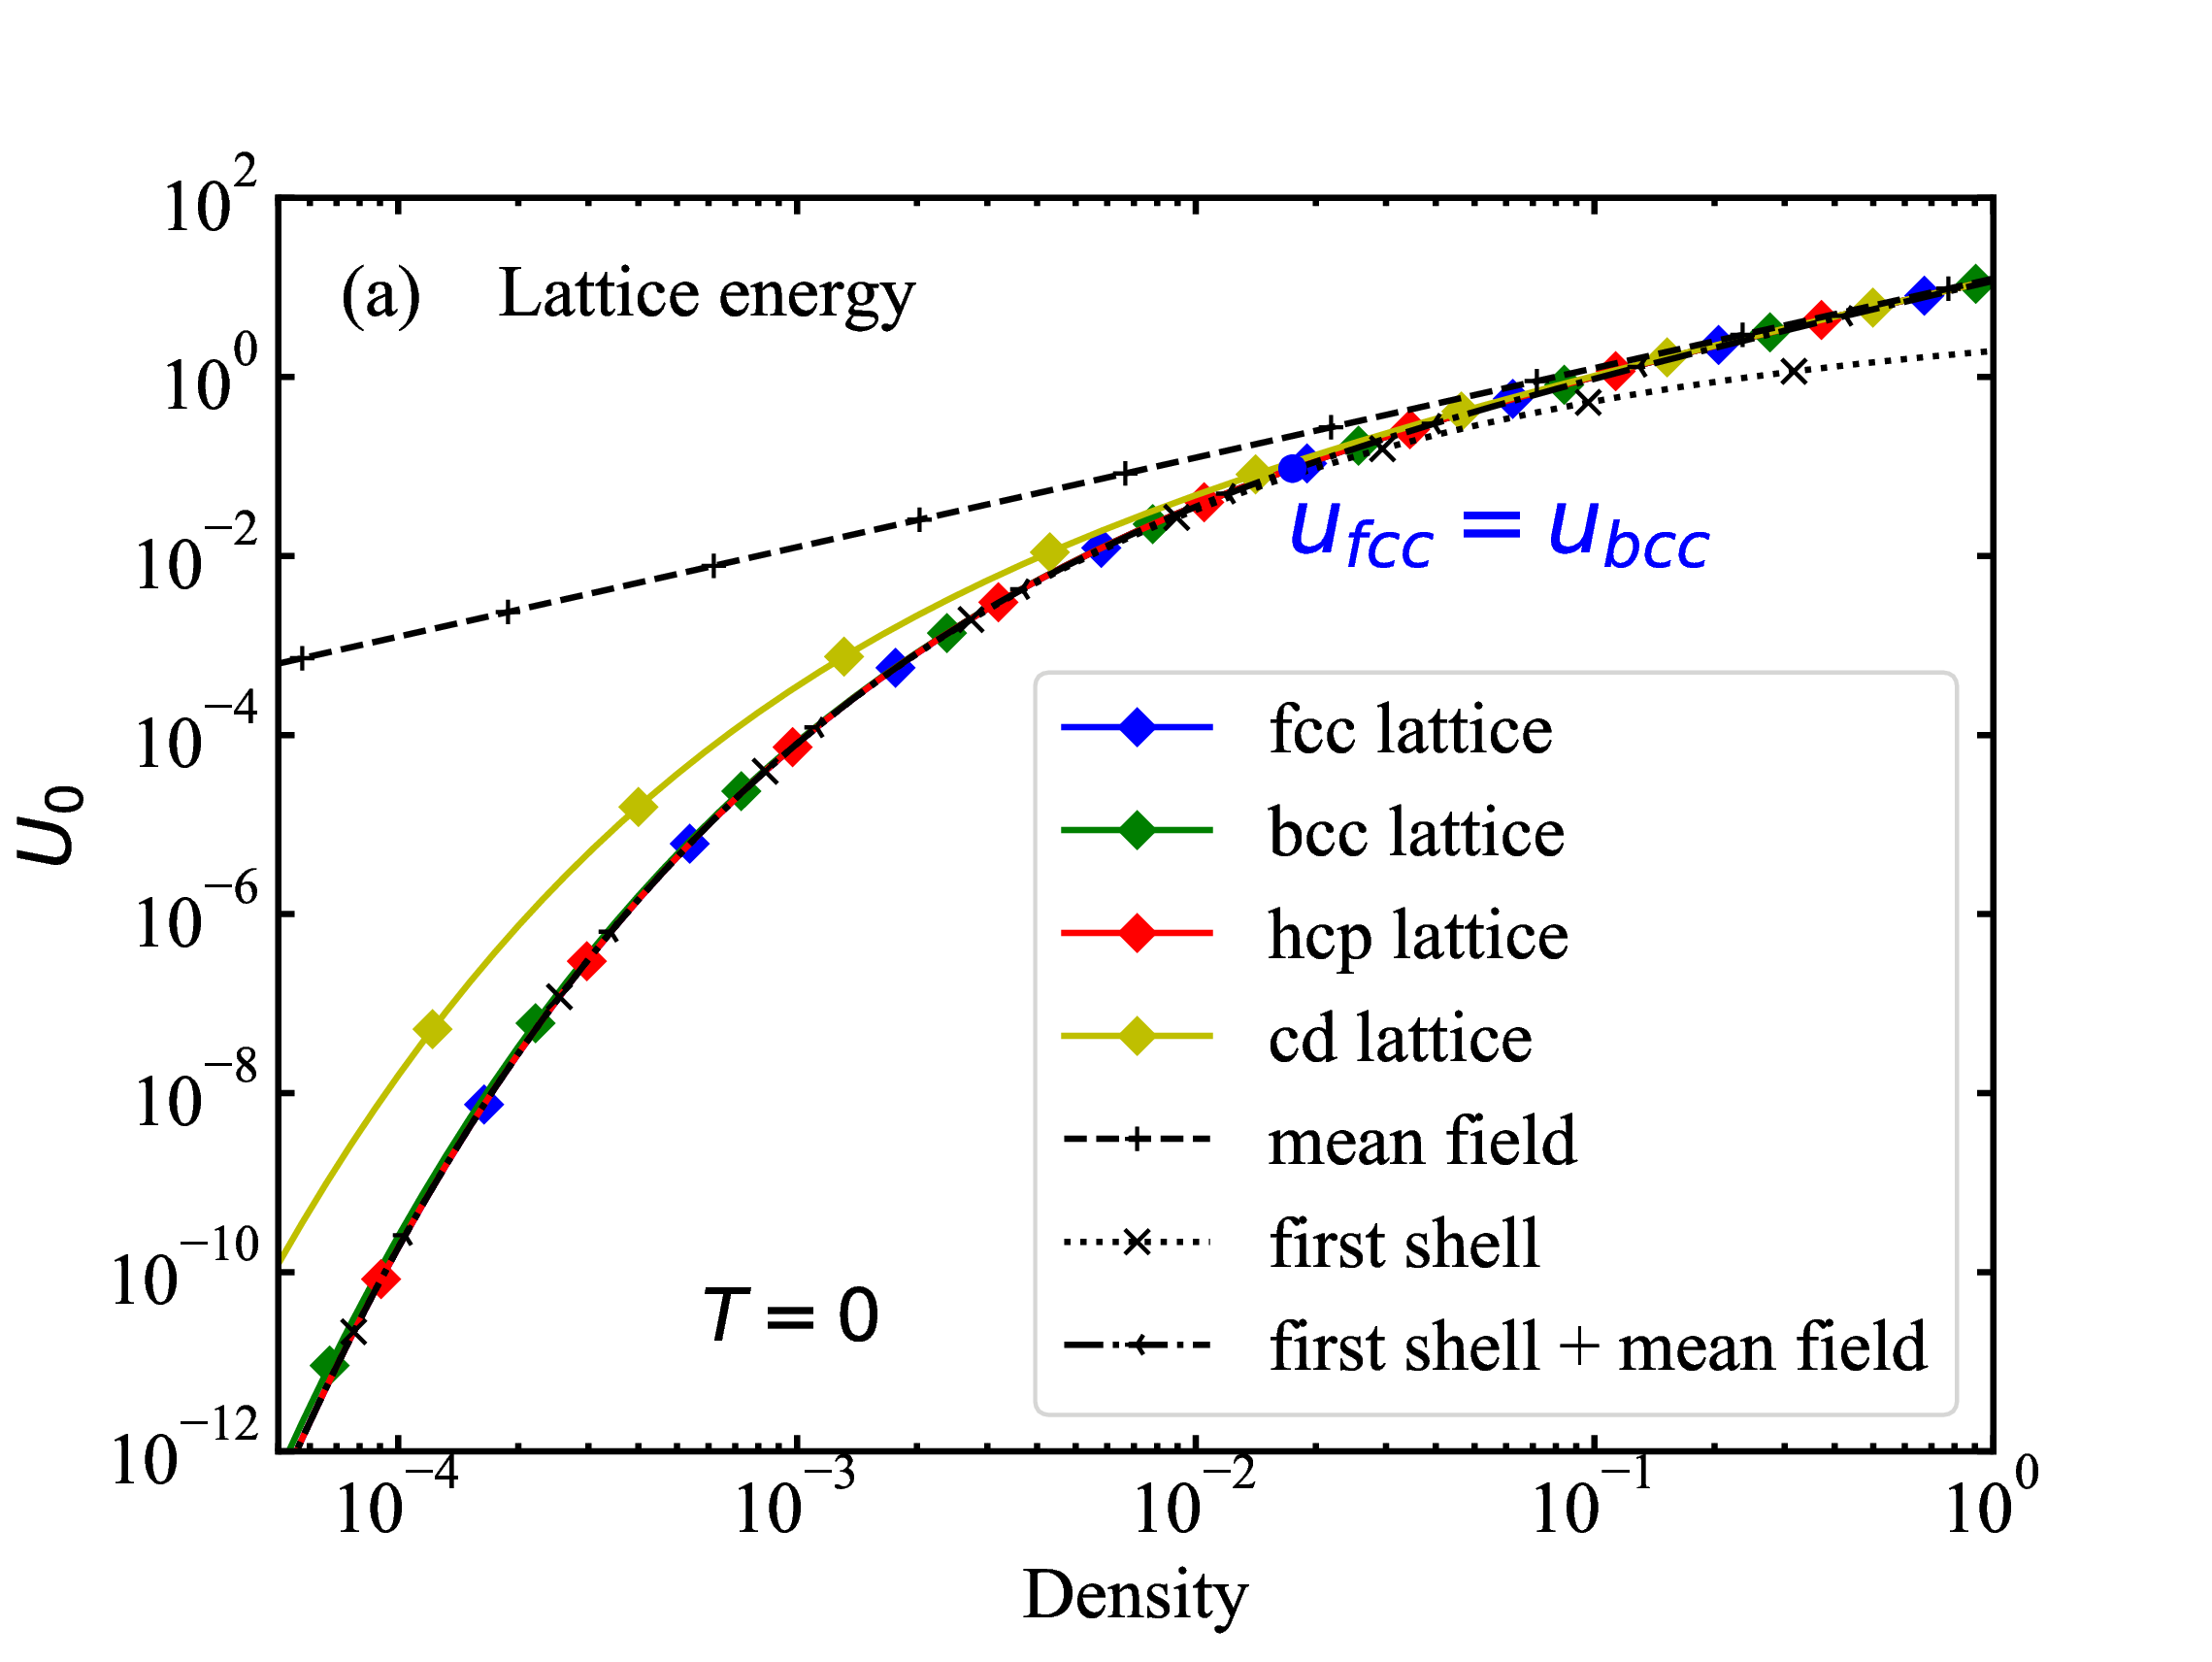 fig/fig1a.pdf
Relative difference (fcc and bcc) in lattice energies as function of density at T=0
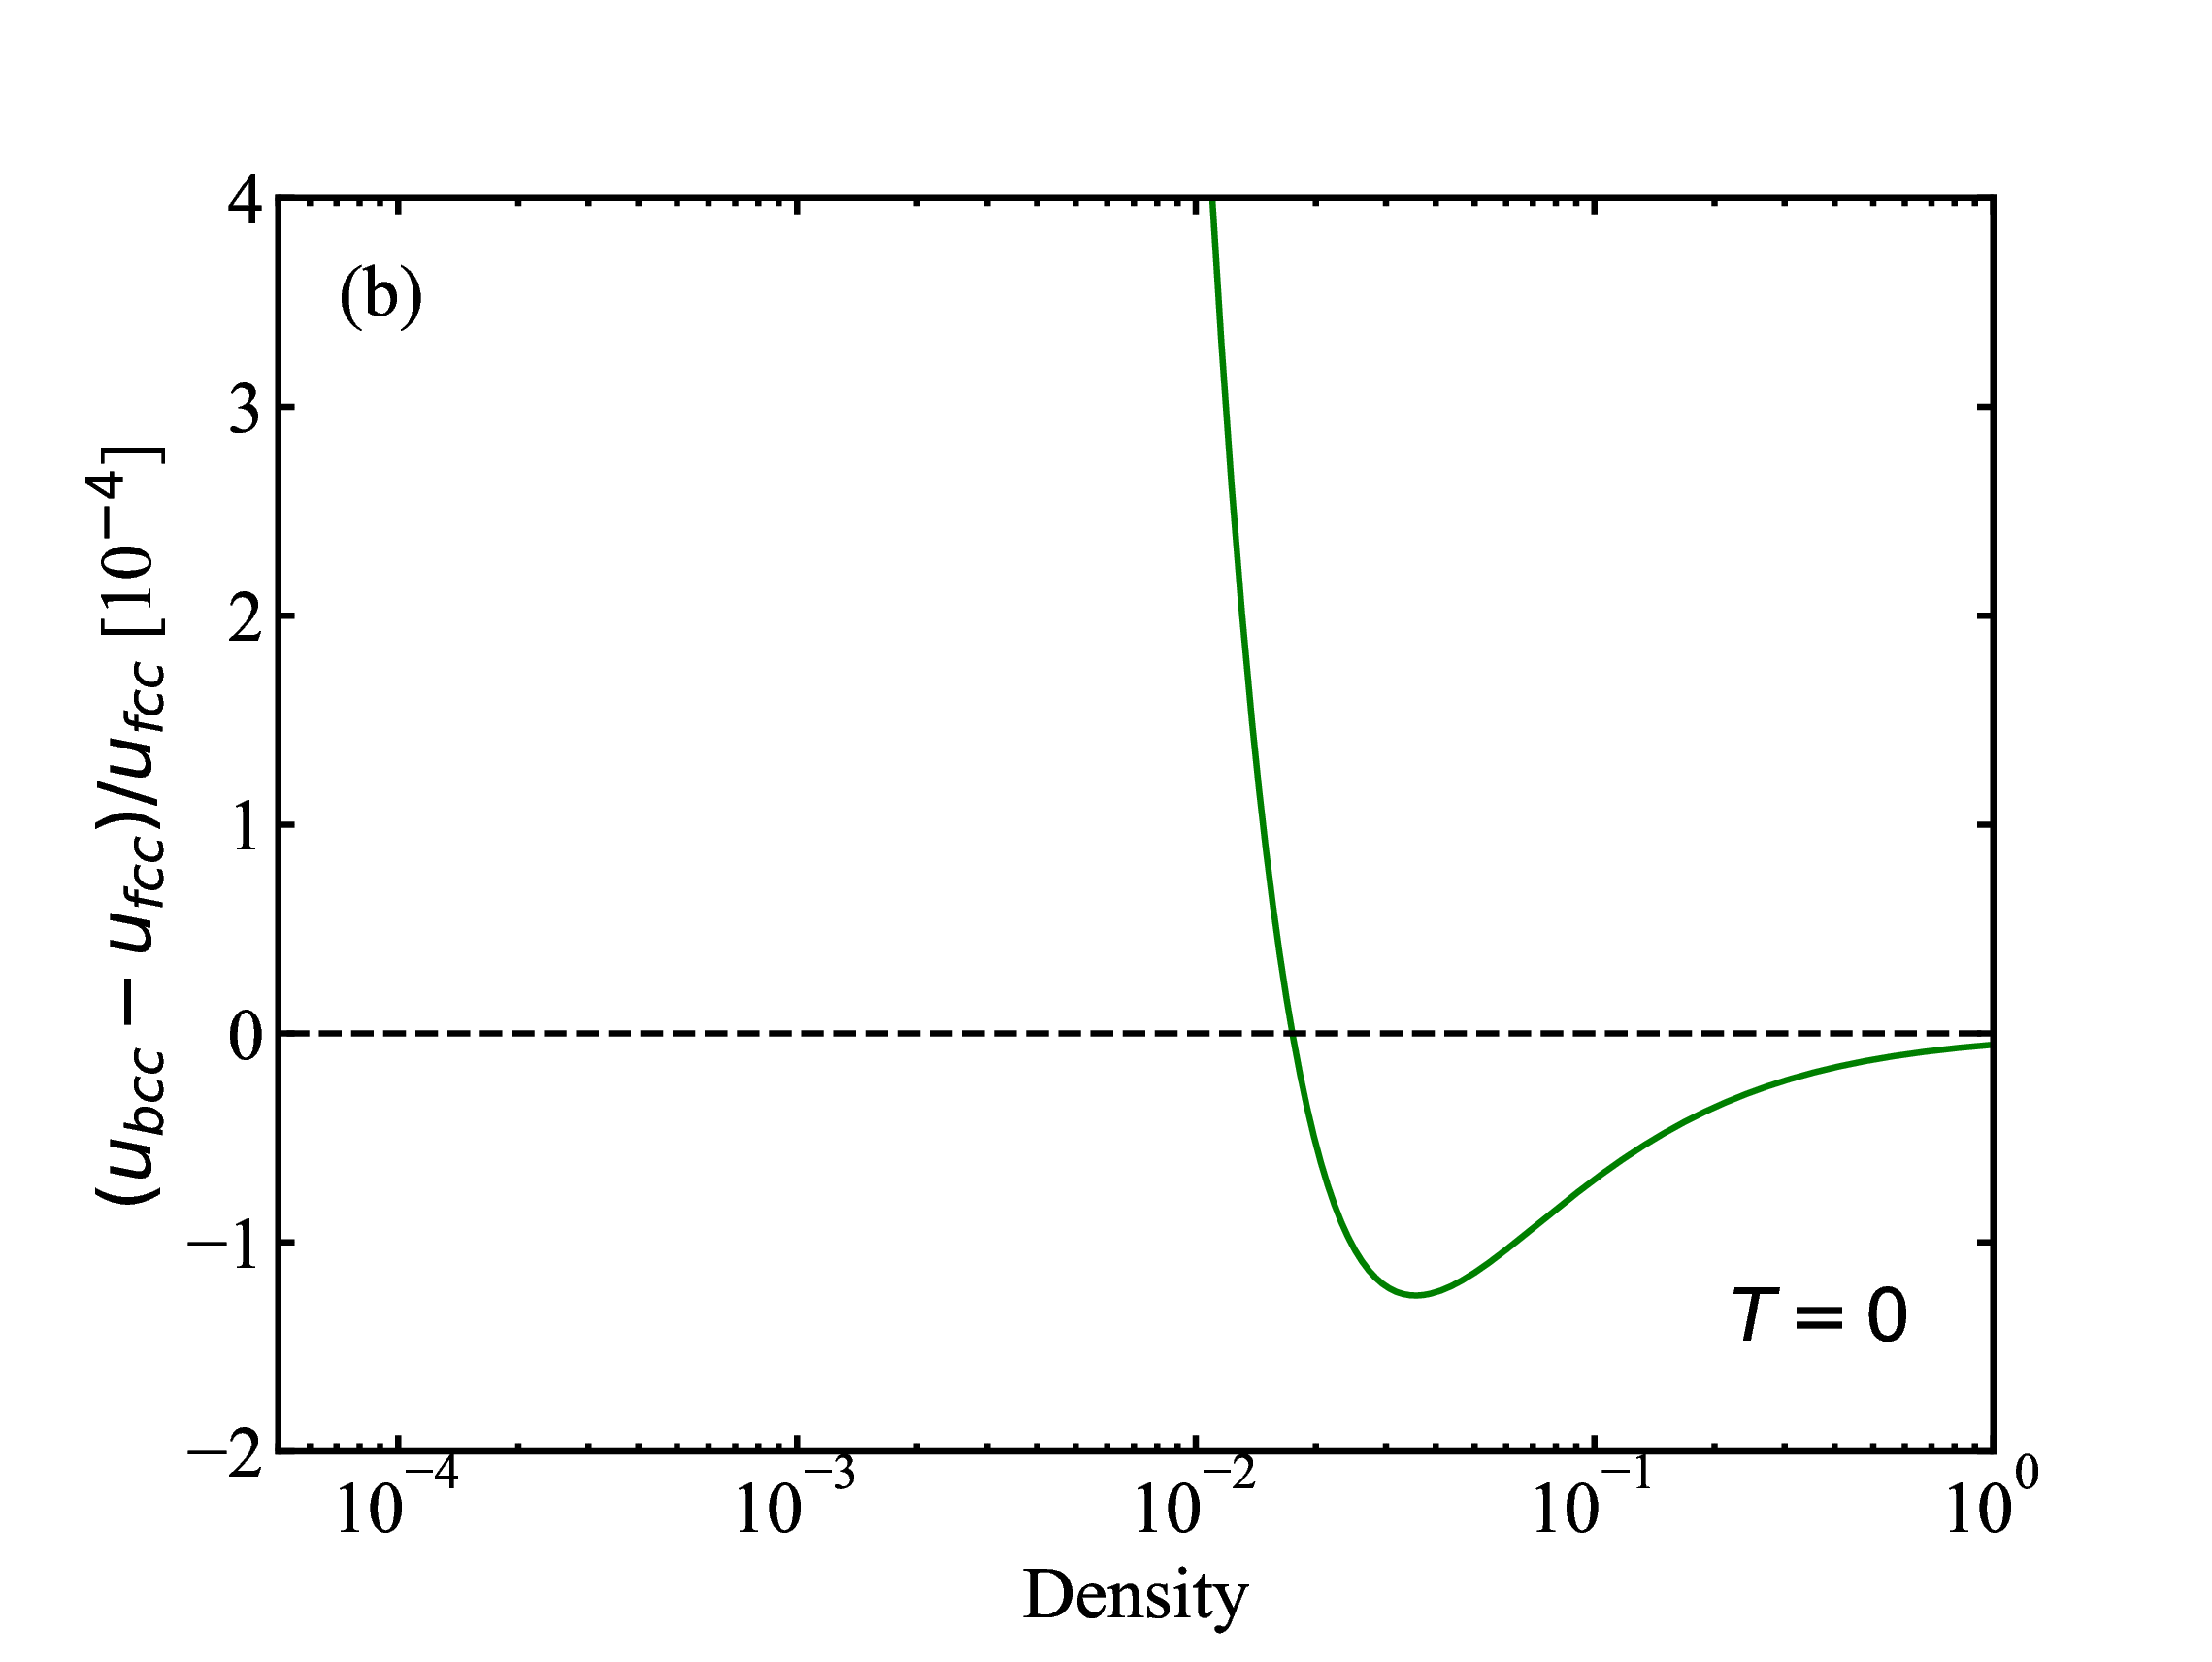 fig/fig1b.pdf
Relative difference (fcc and hcp) in lattice energies as function of density at T=0
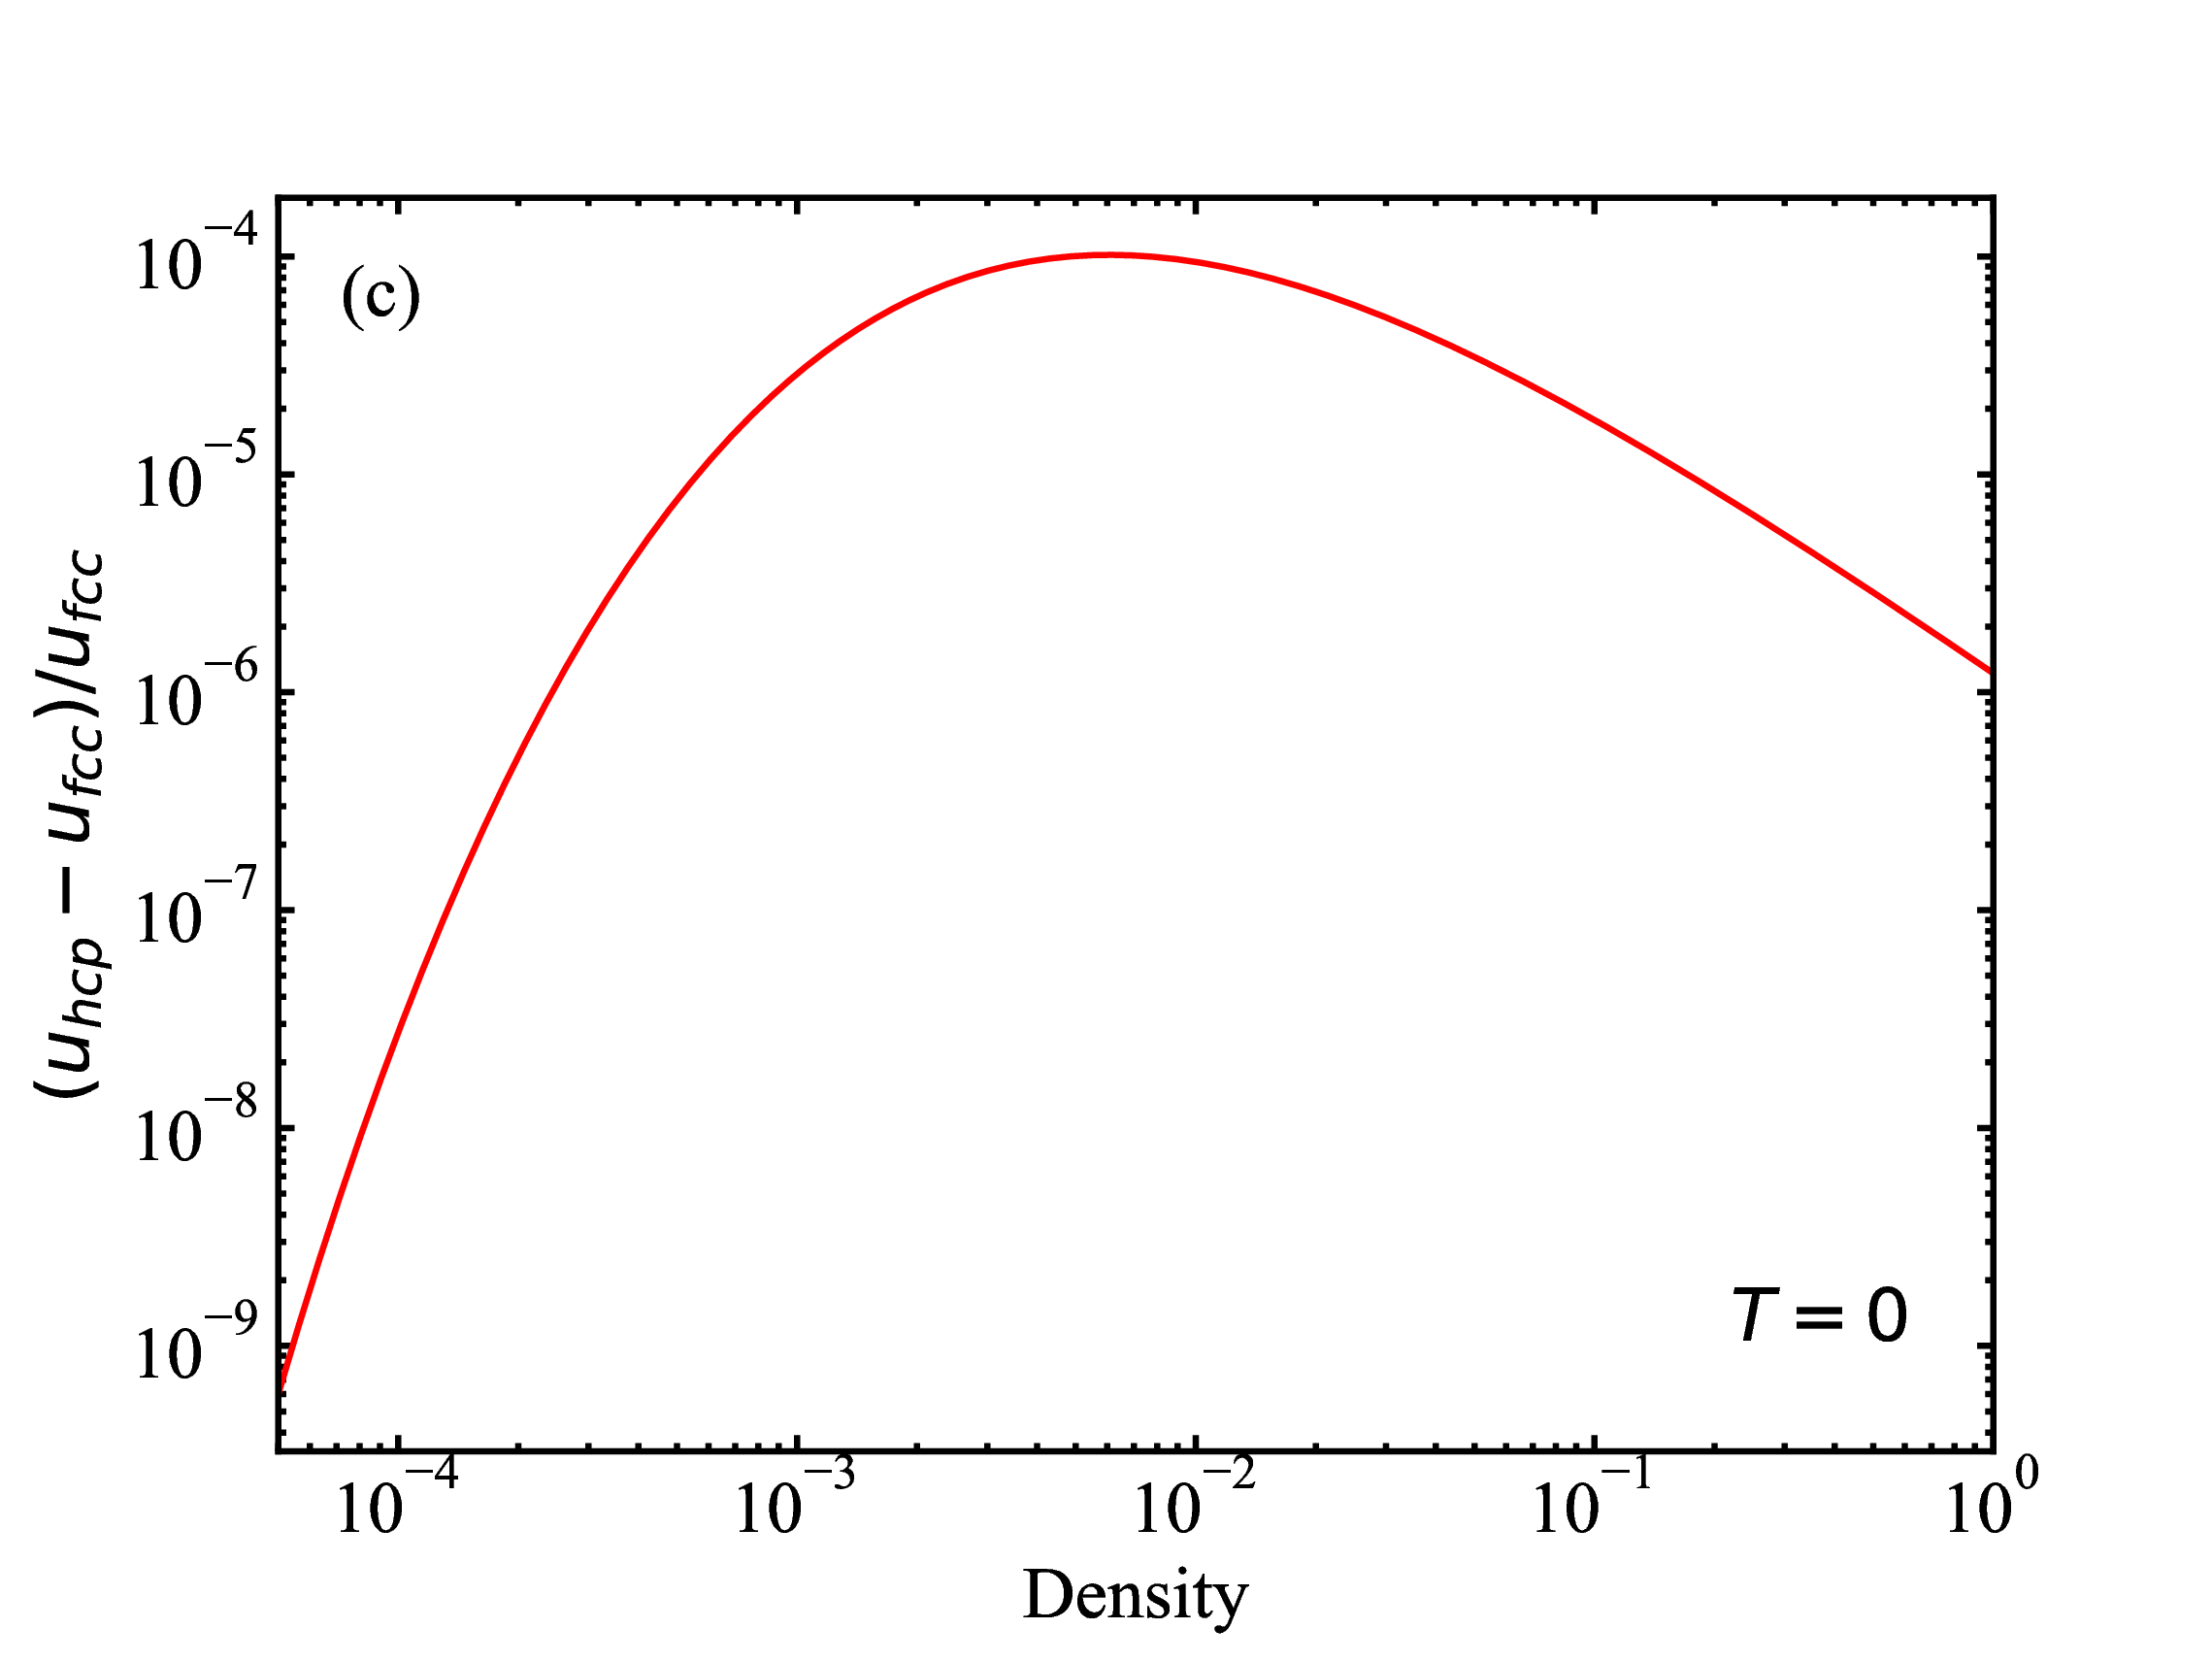 fig/fig1c.pdf
Relative difference (fcc and cd) in lattice energies as function of density at T=0
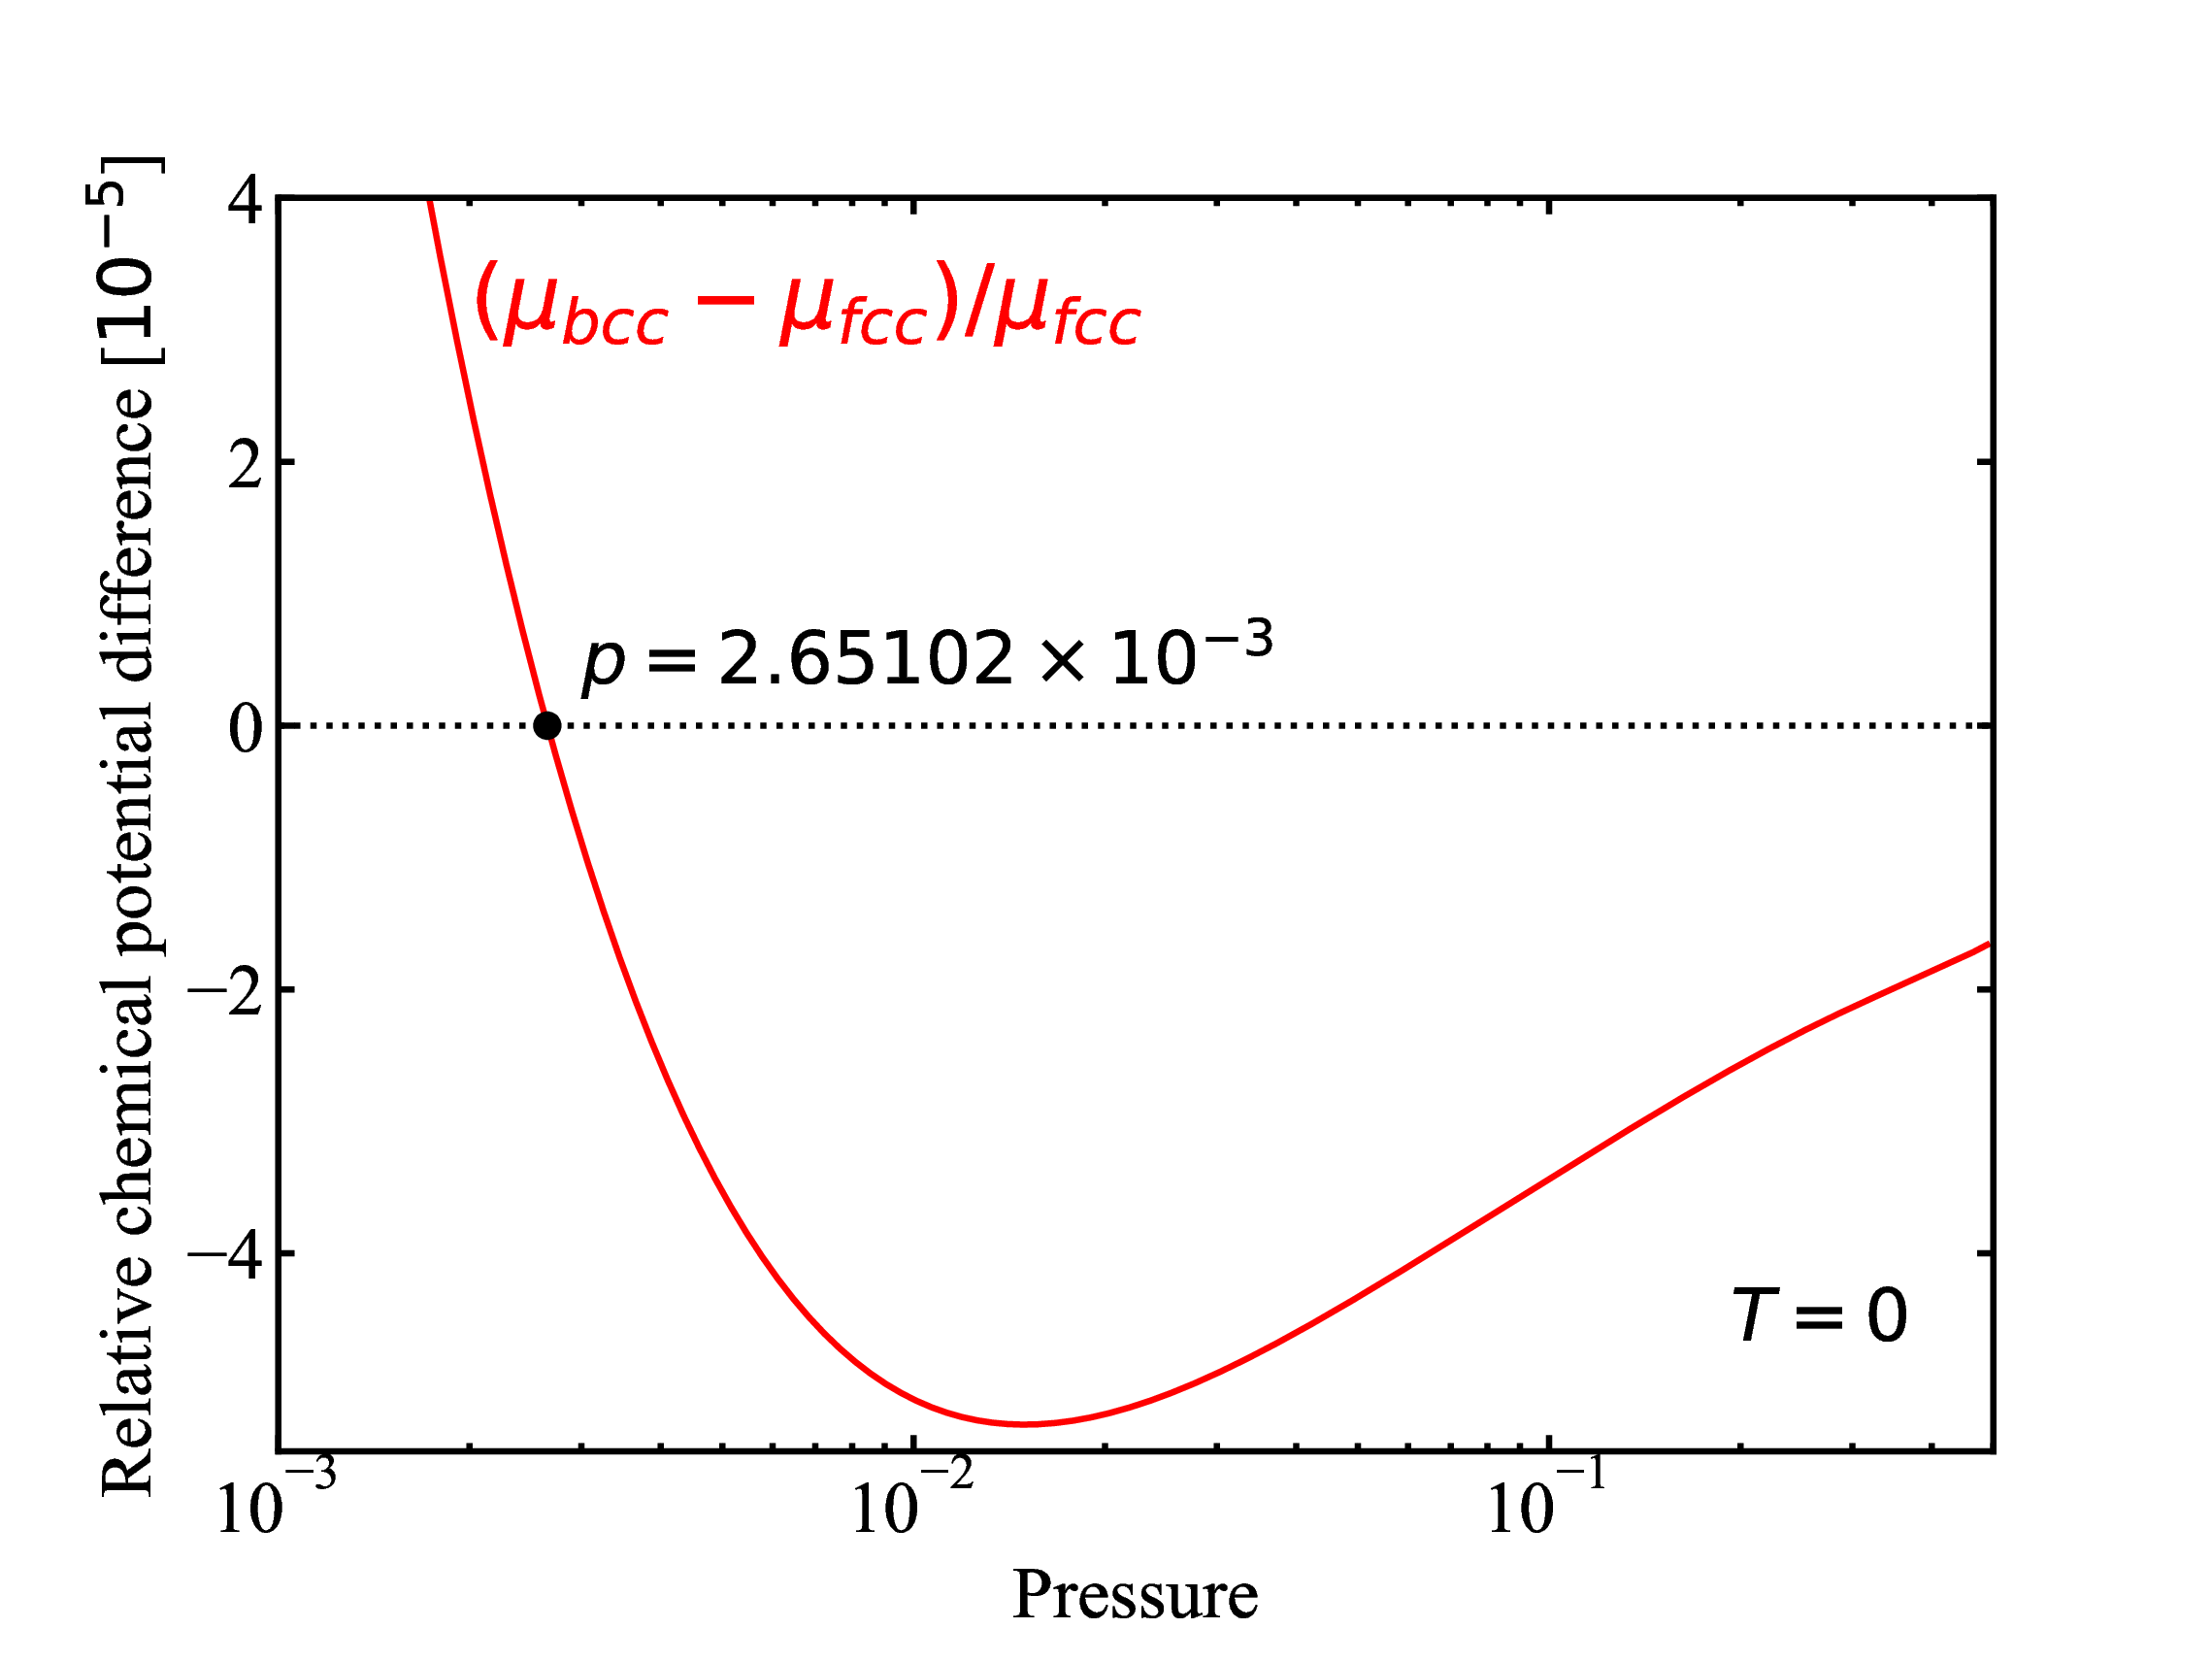
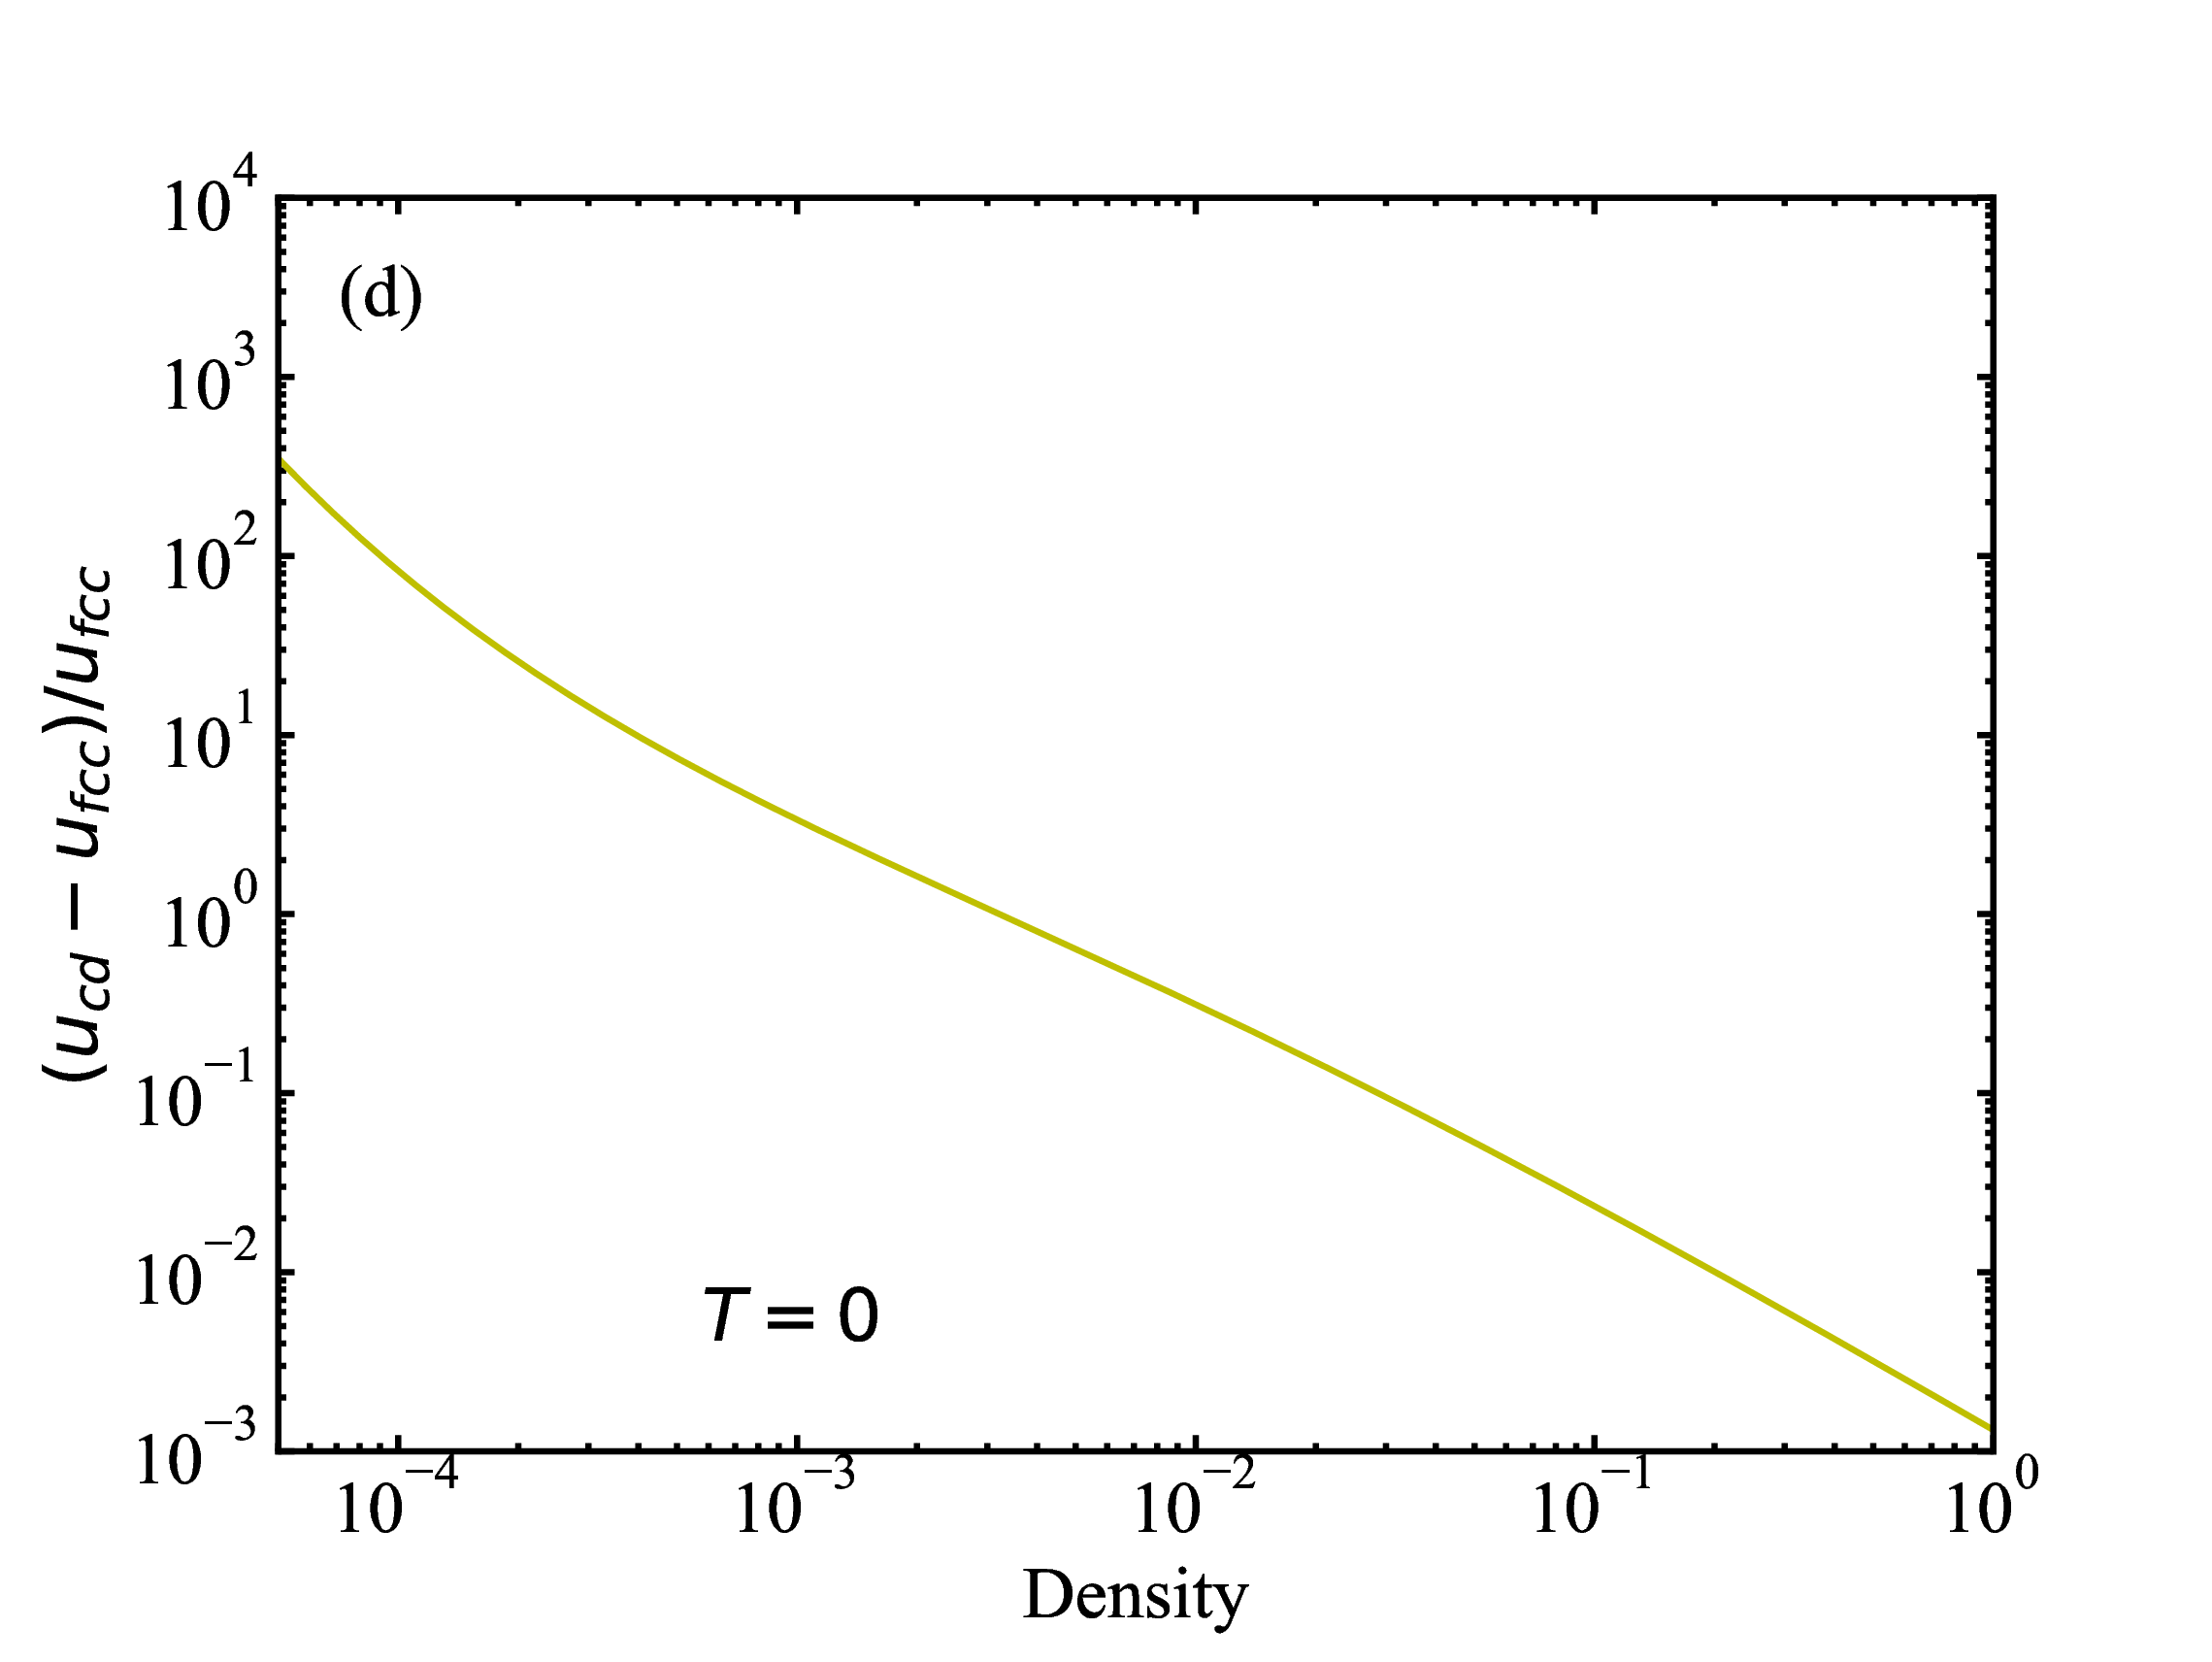 fig/fig1d.pdf
Relative difference (fcc and bcc) in chemical potential as function of pressure at T=0
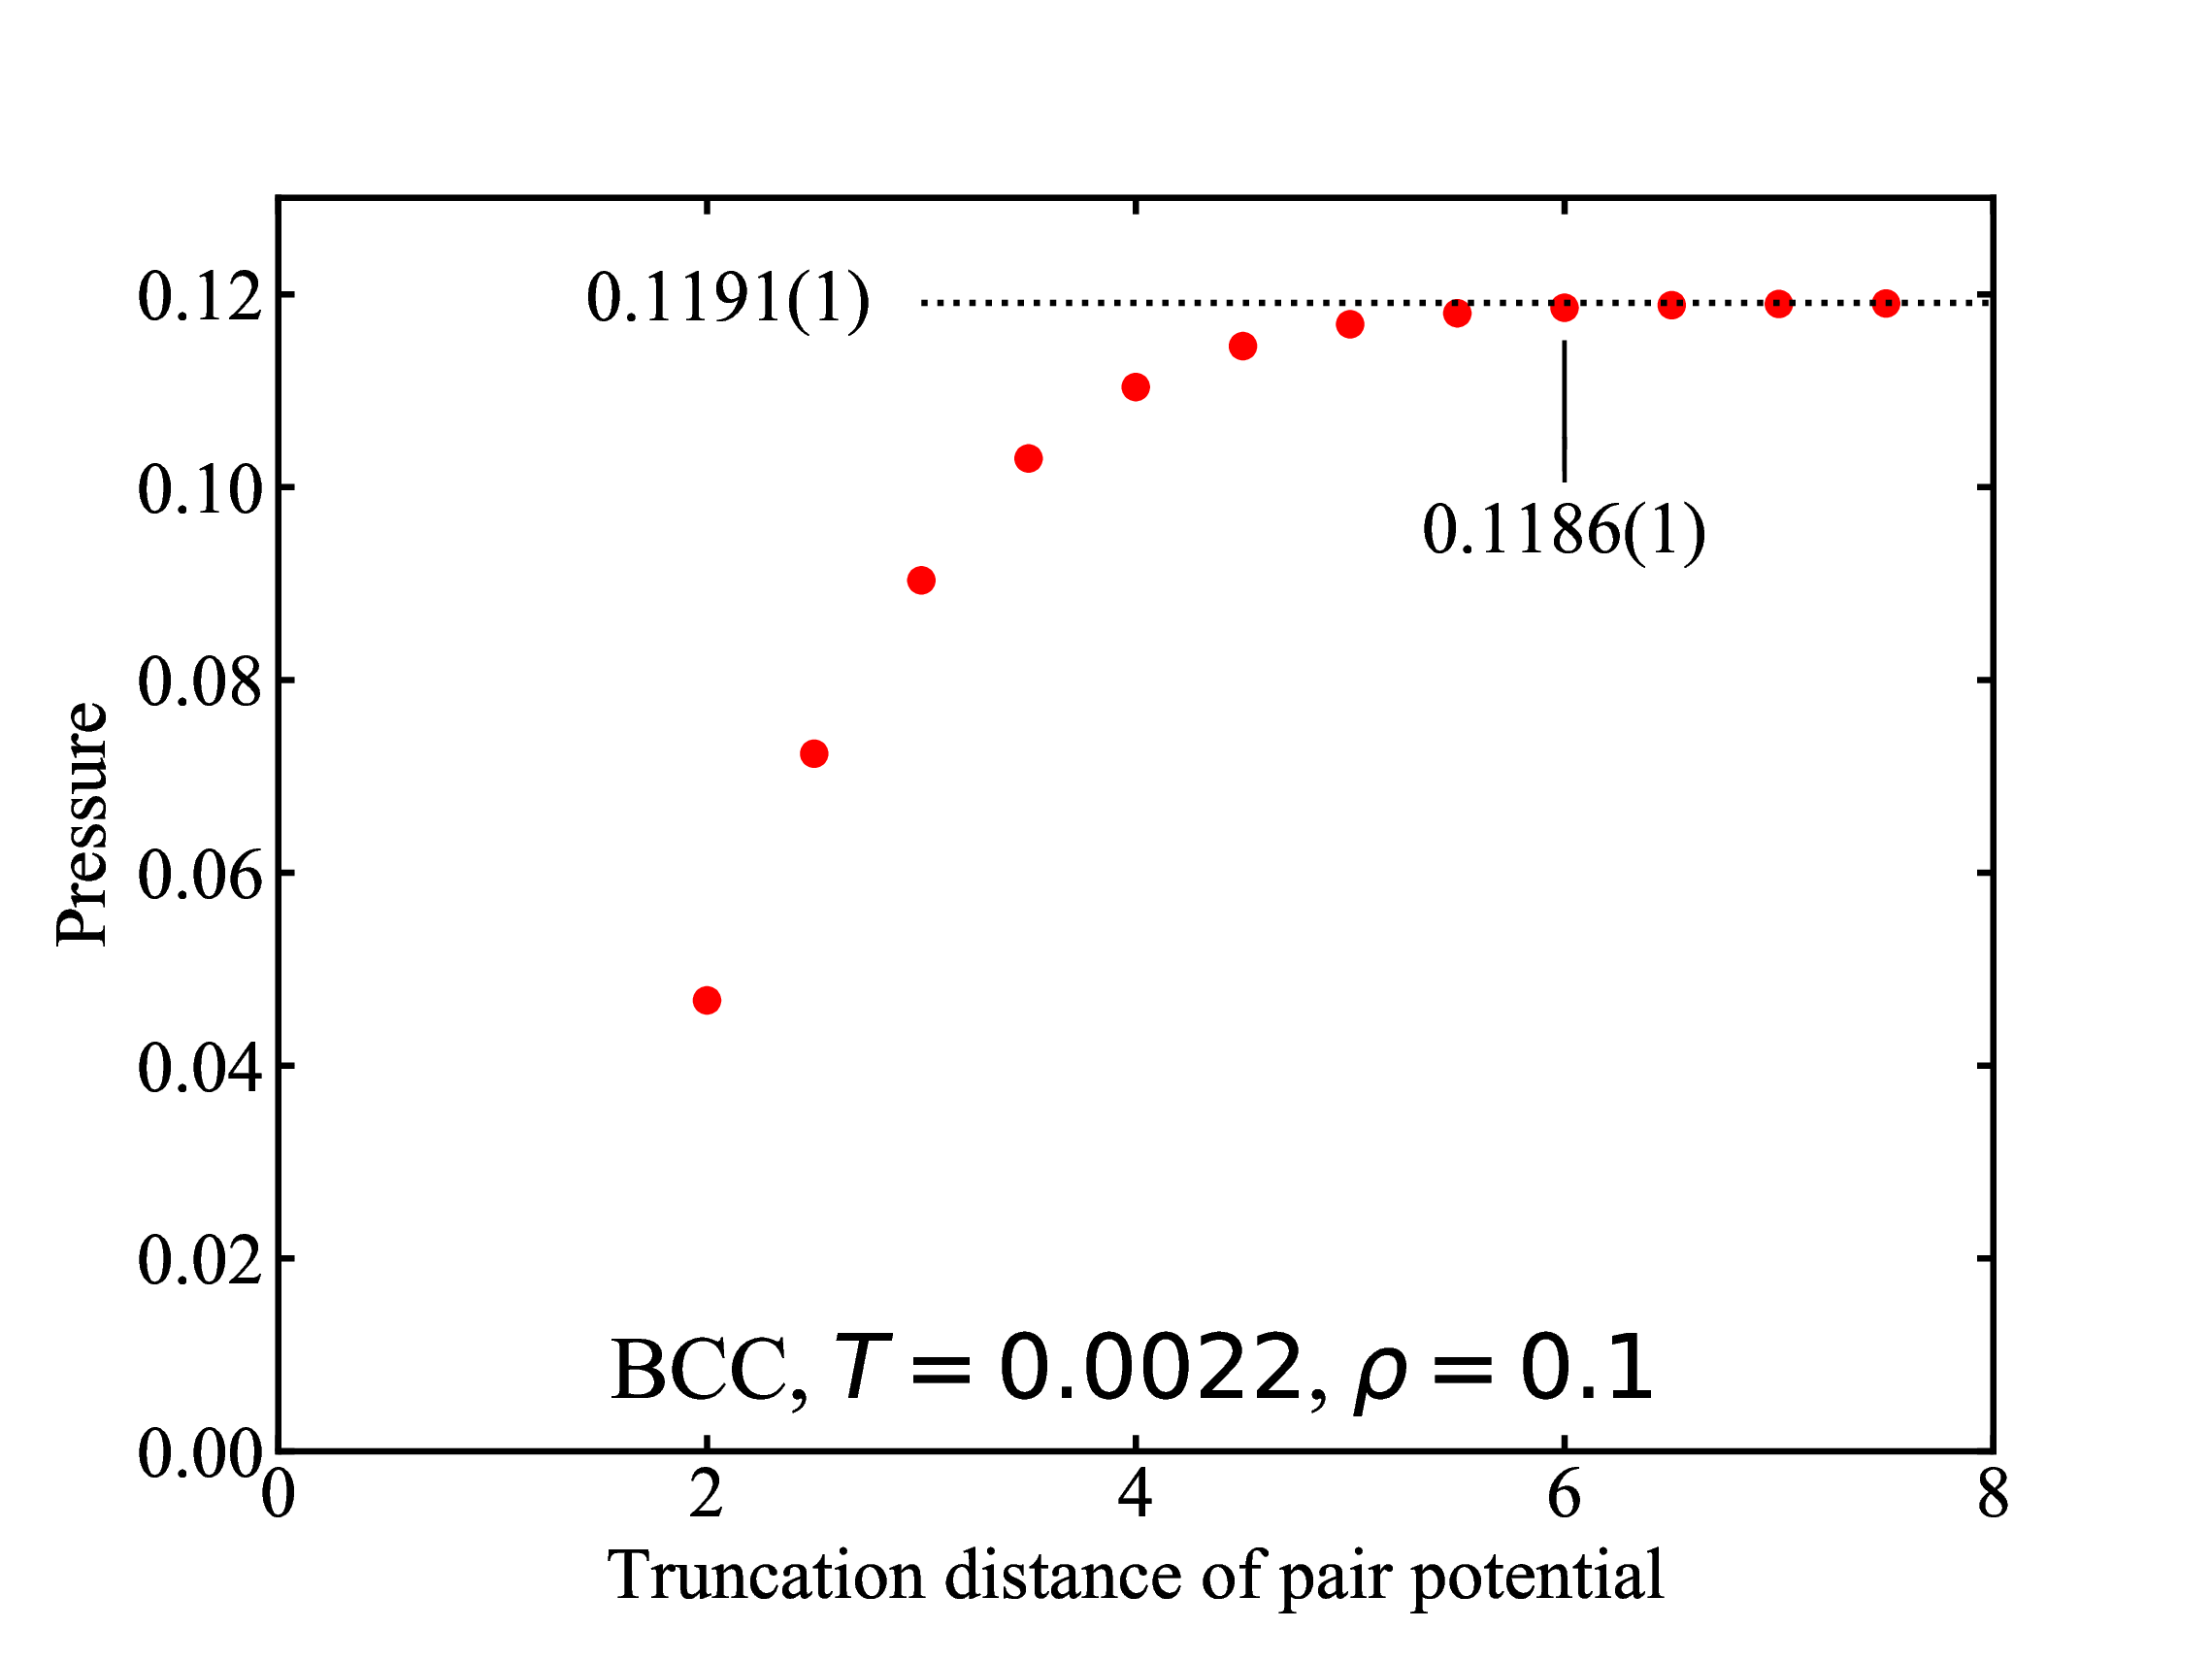
 fig/fig2.pdf
Pressure as function of trucation distance
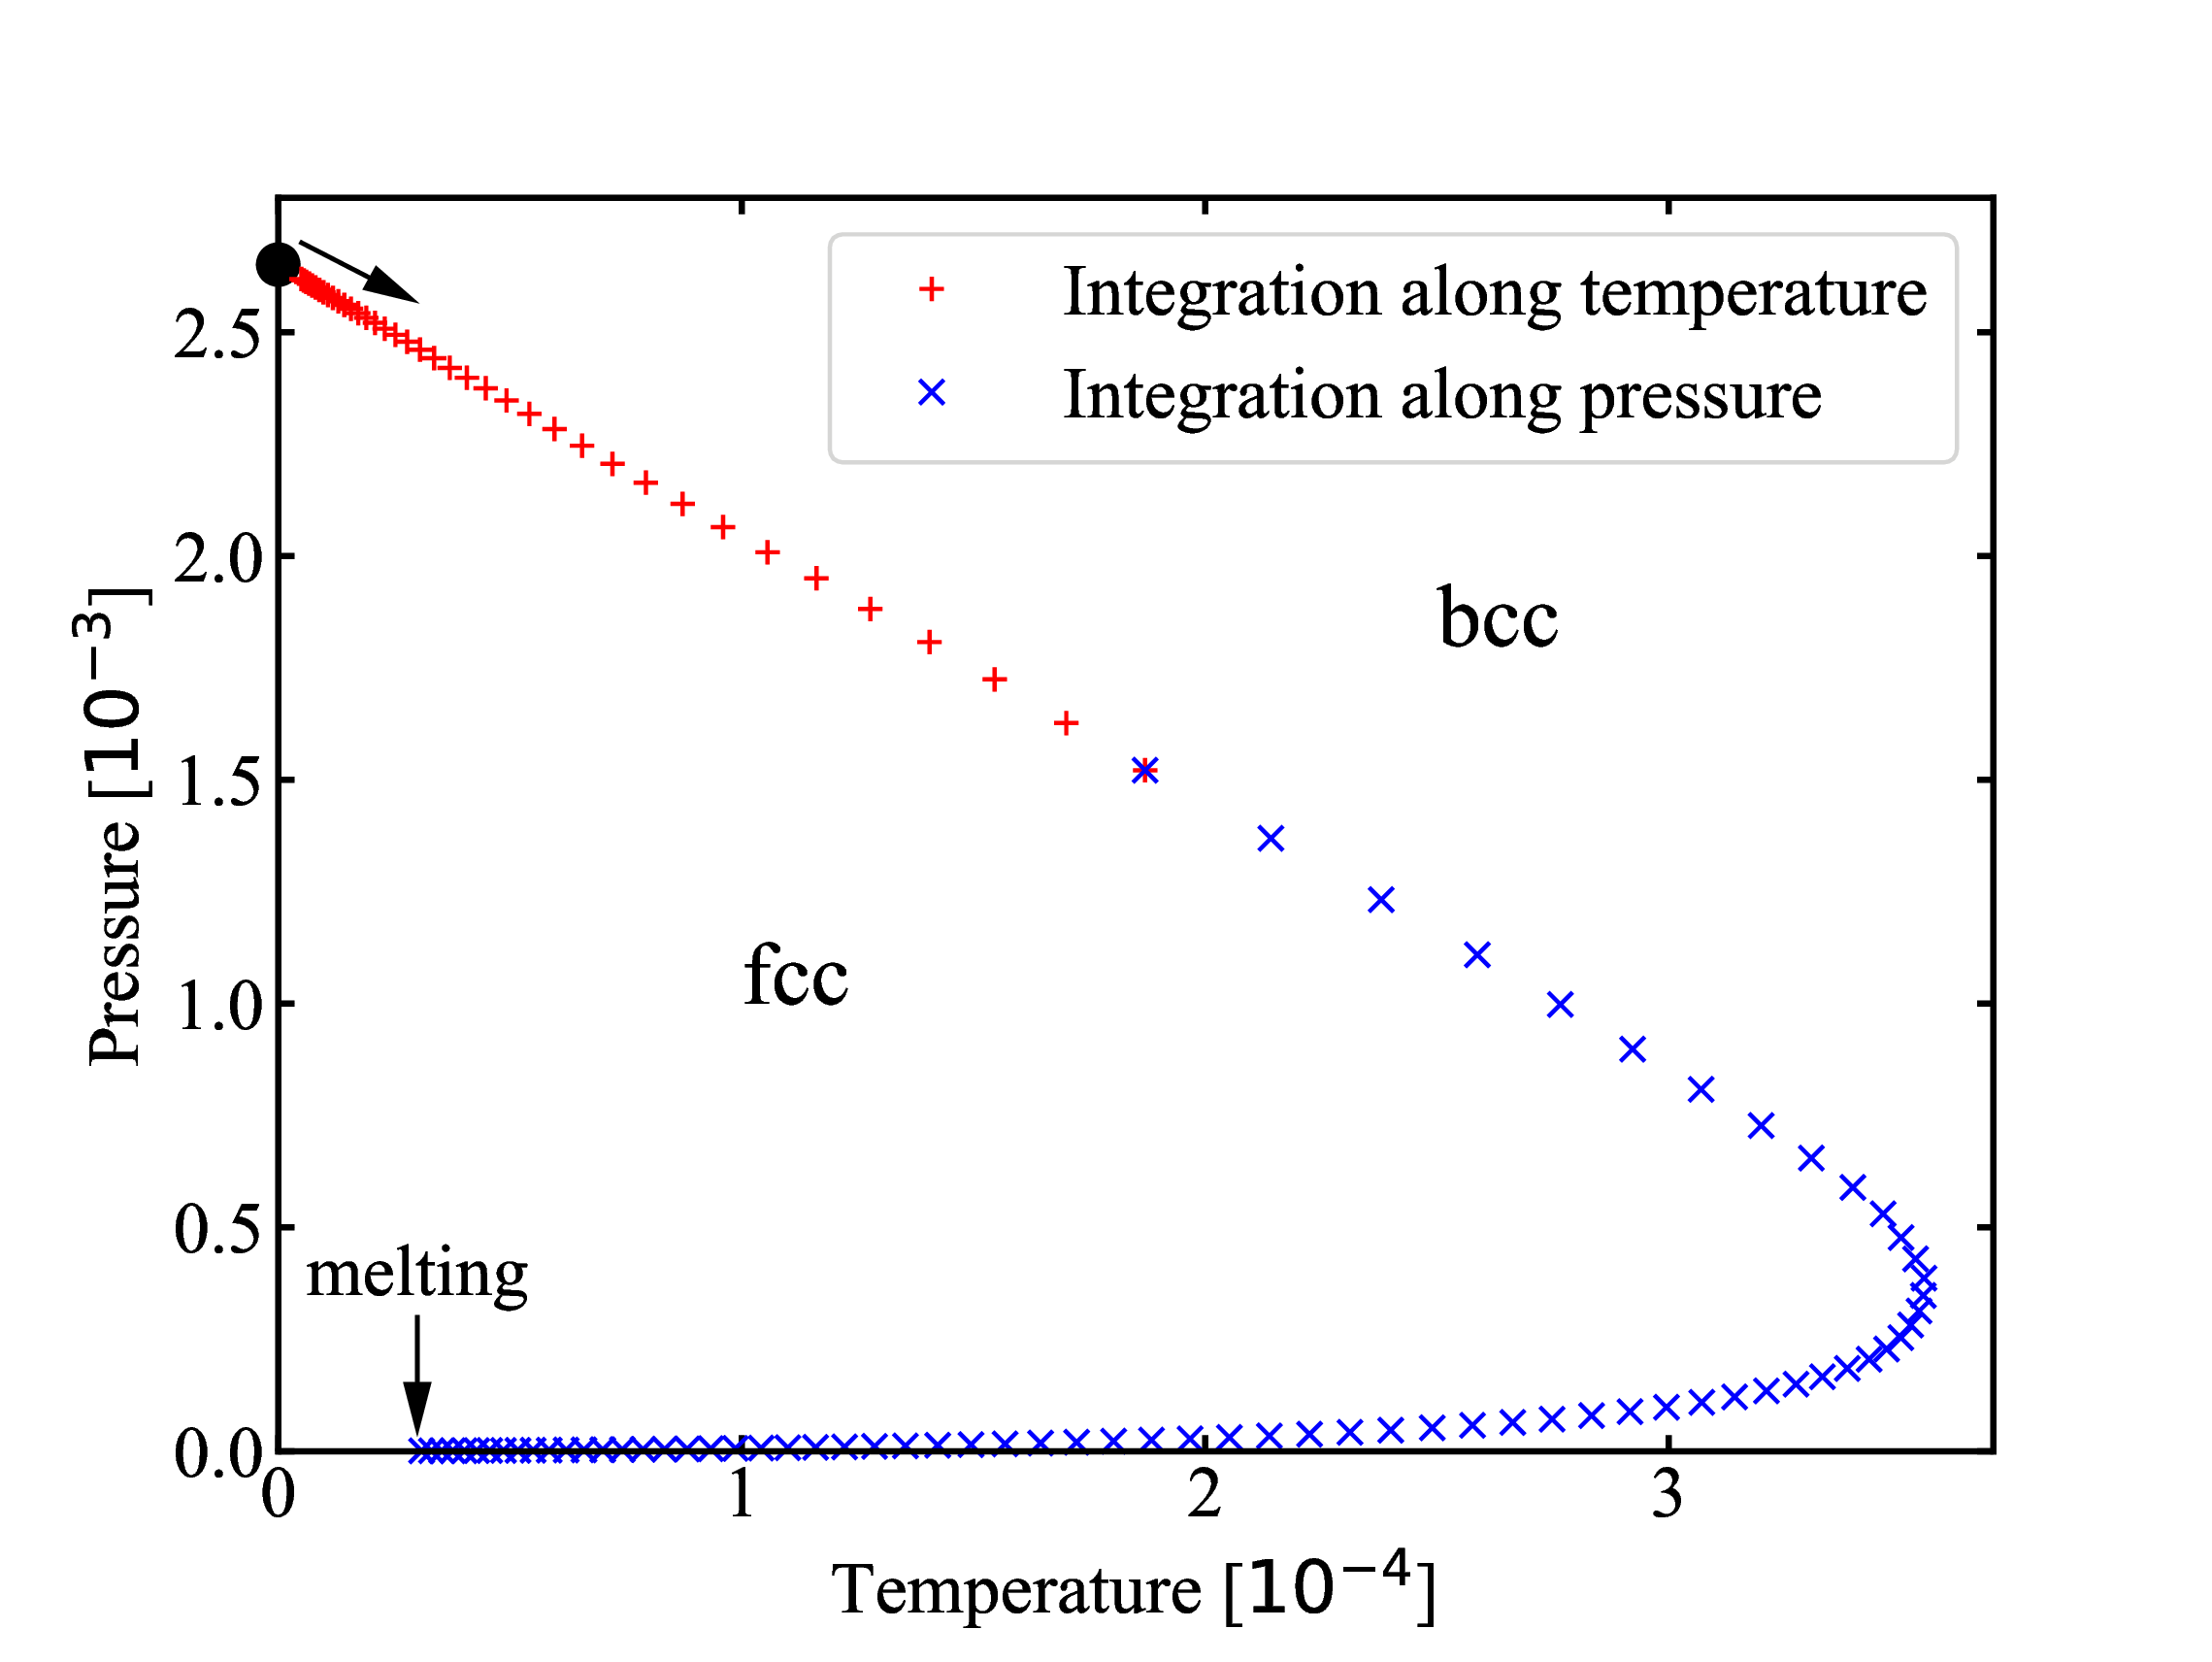
 fig/fig3.pdf
Fcc-bcc coexistence from Clausius-Clapeyron integration
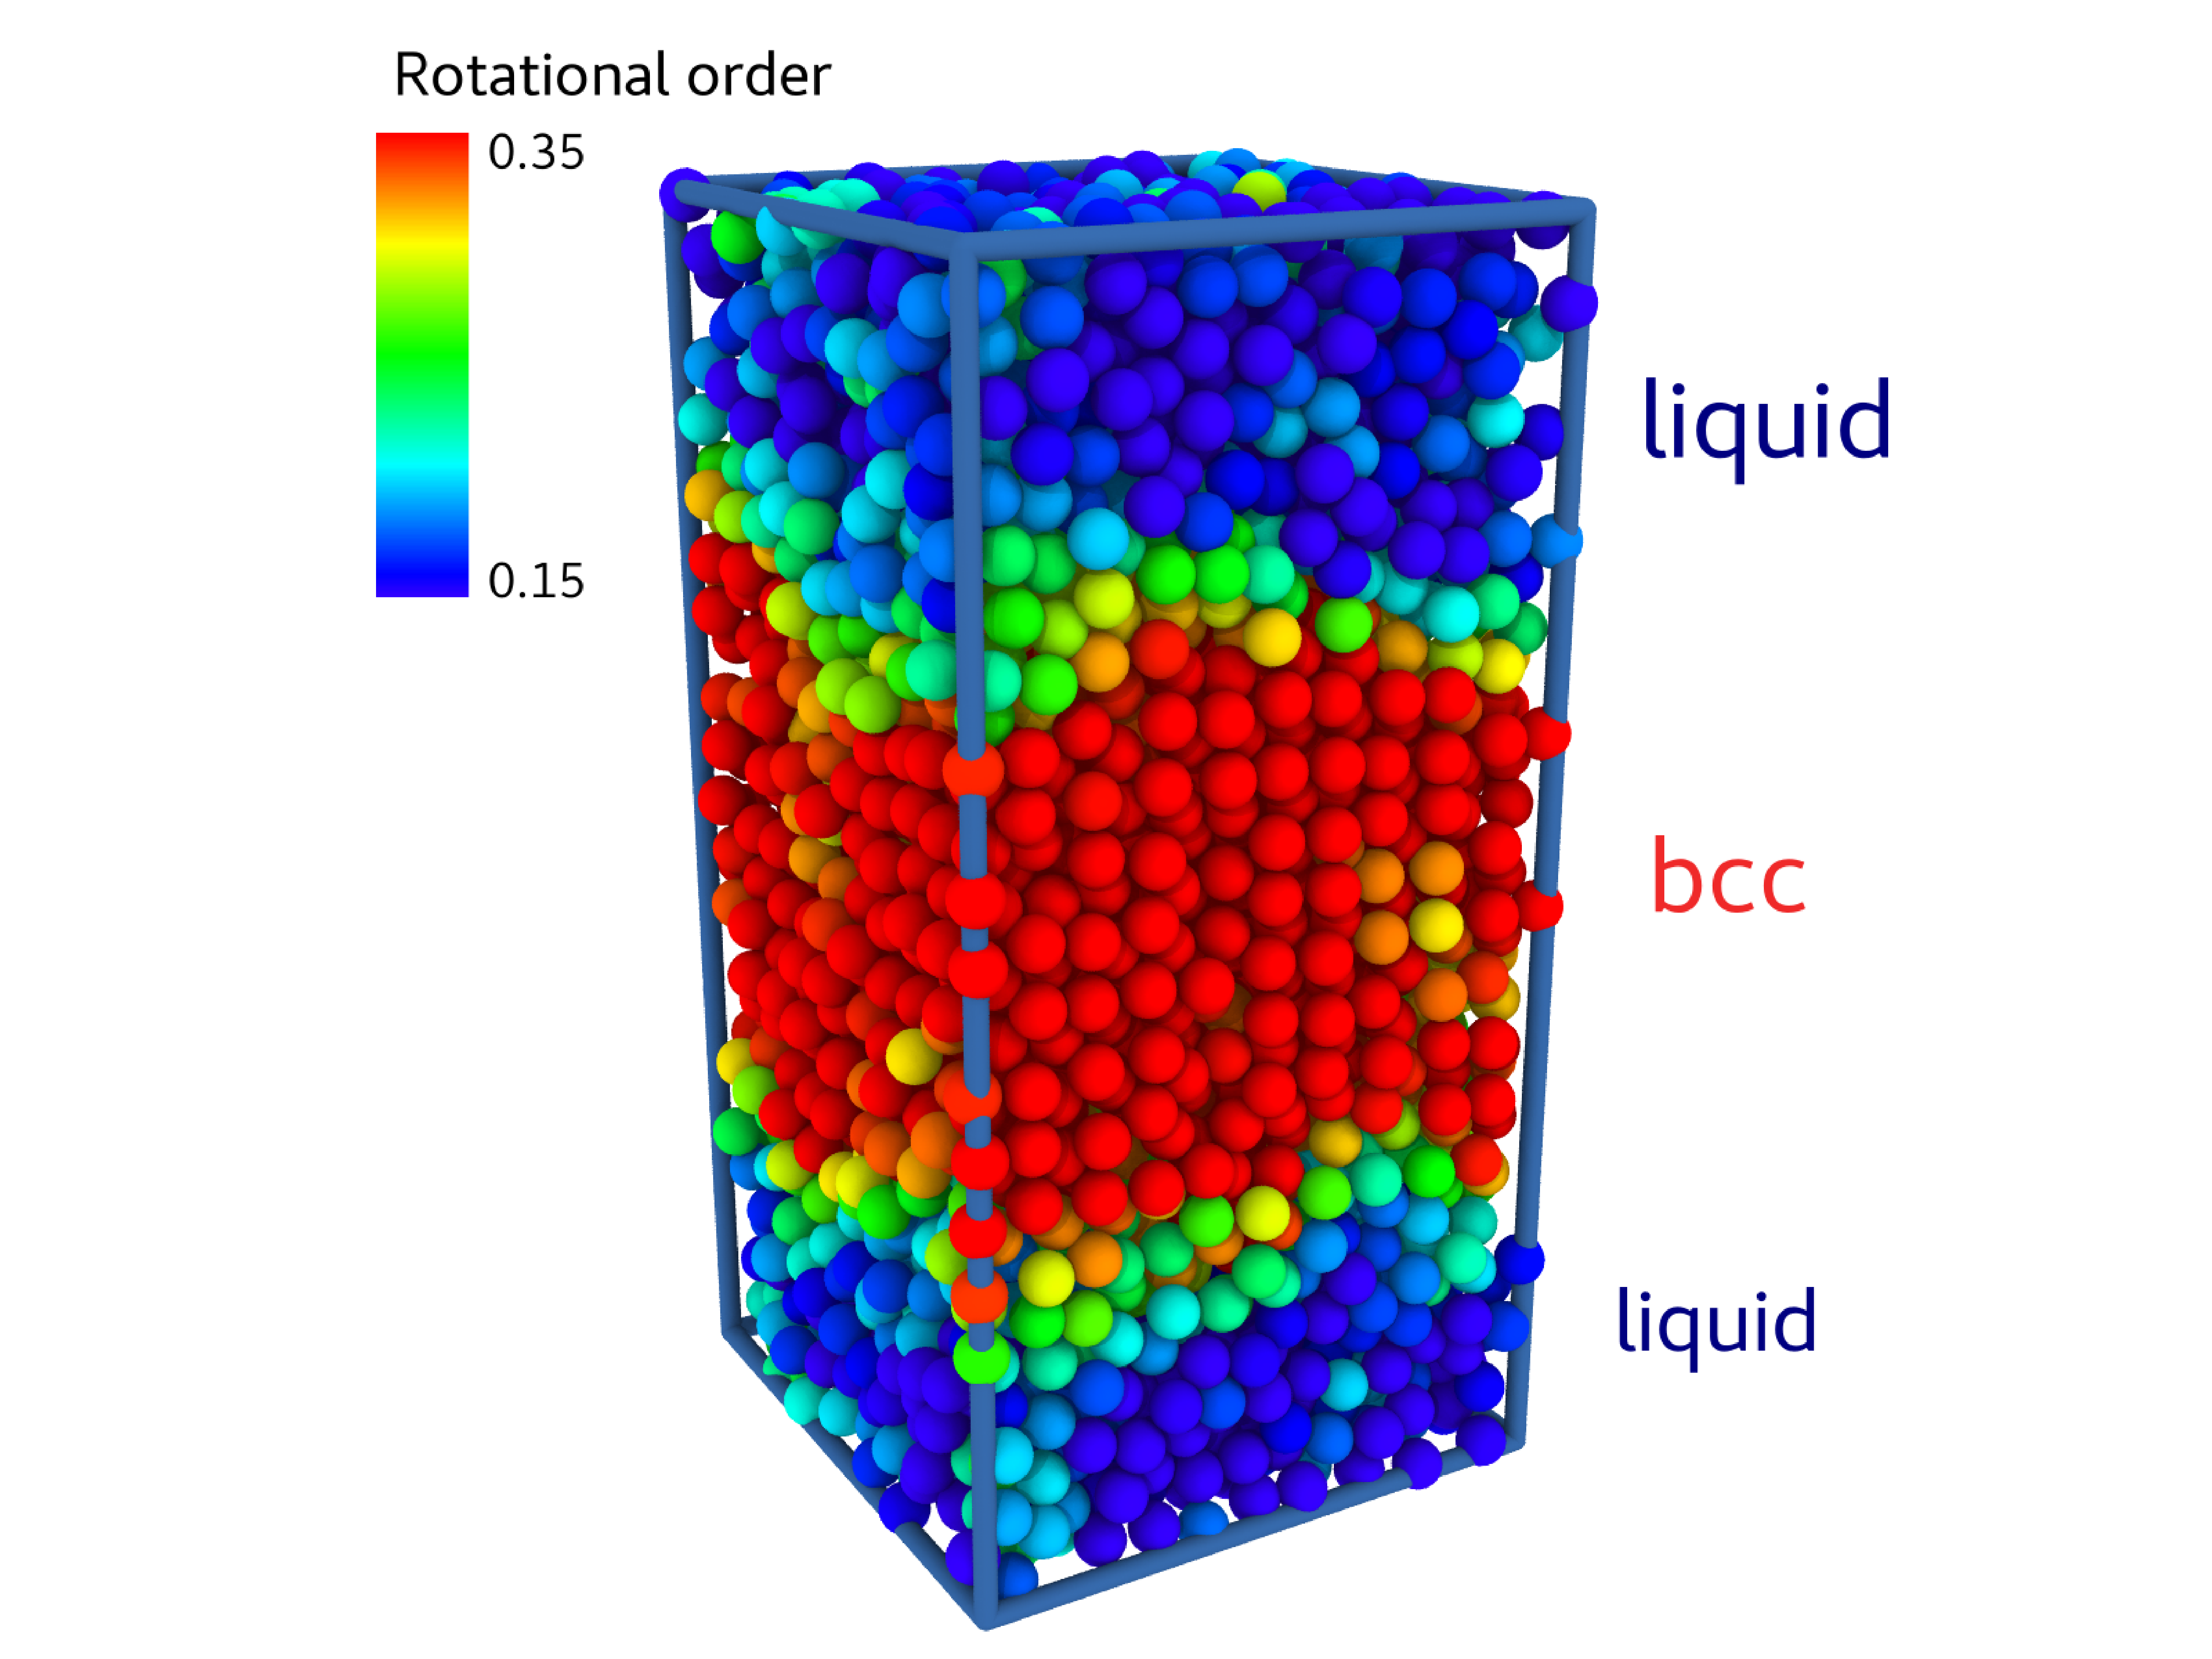
 fig/fig4.pdf
Configuration from interface-pinning
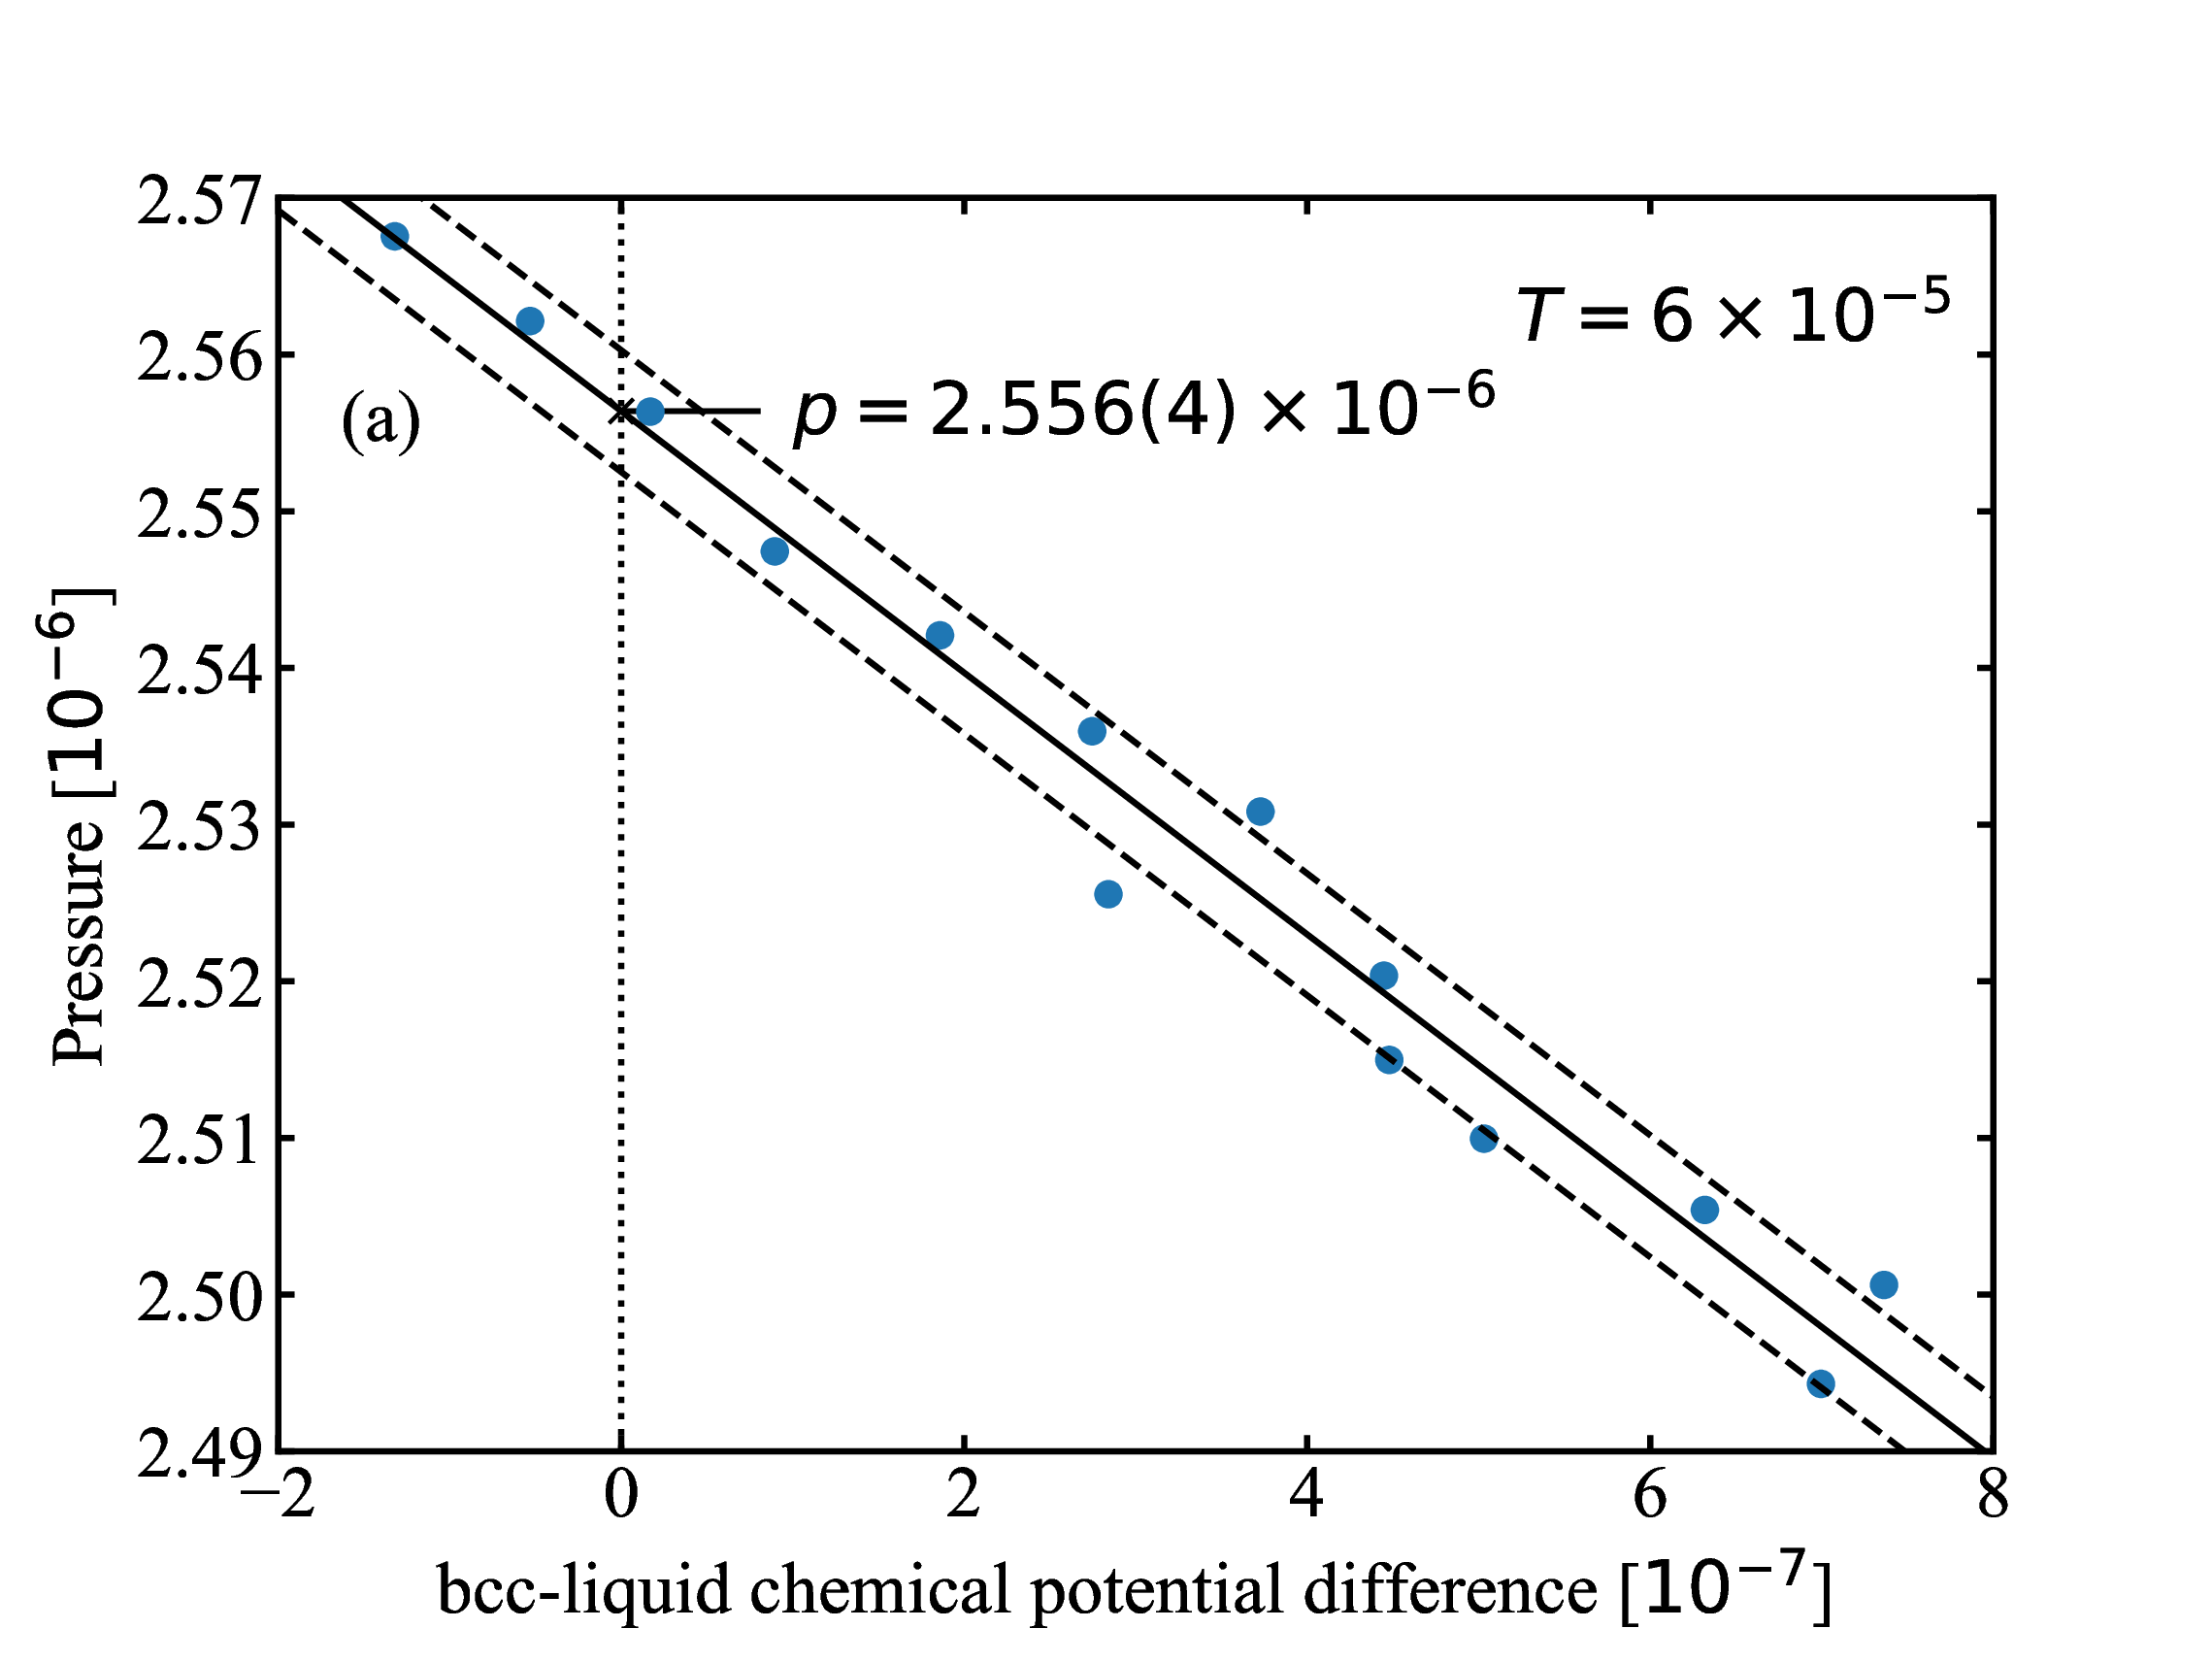
 fig/fig5.pdf
The difference in chemical potential (bcc and liquid) from interface-pinning plotted against pressure
 fig/fig6a.pdf
Relative difference of the bcc-liquid and fcc-liquid coexistence pressures plotted as a function of temperature
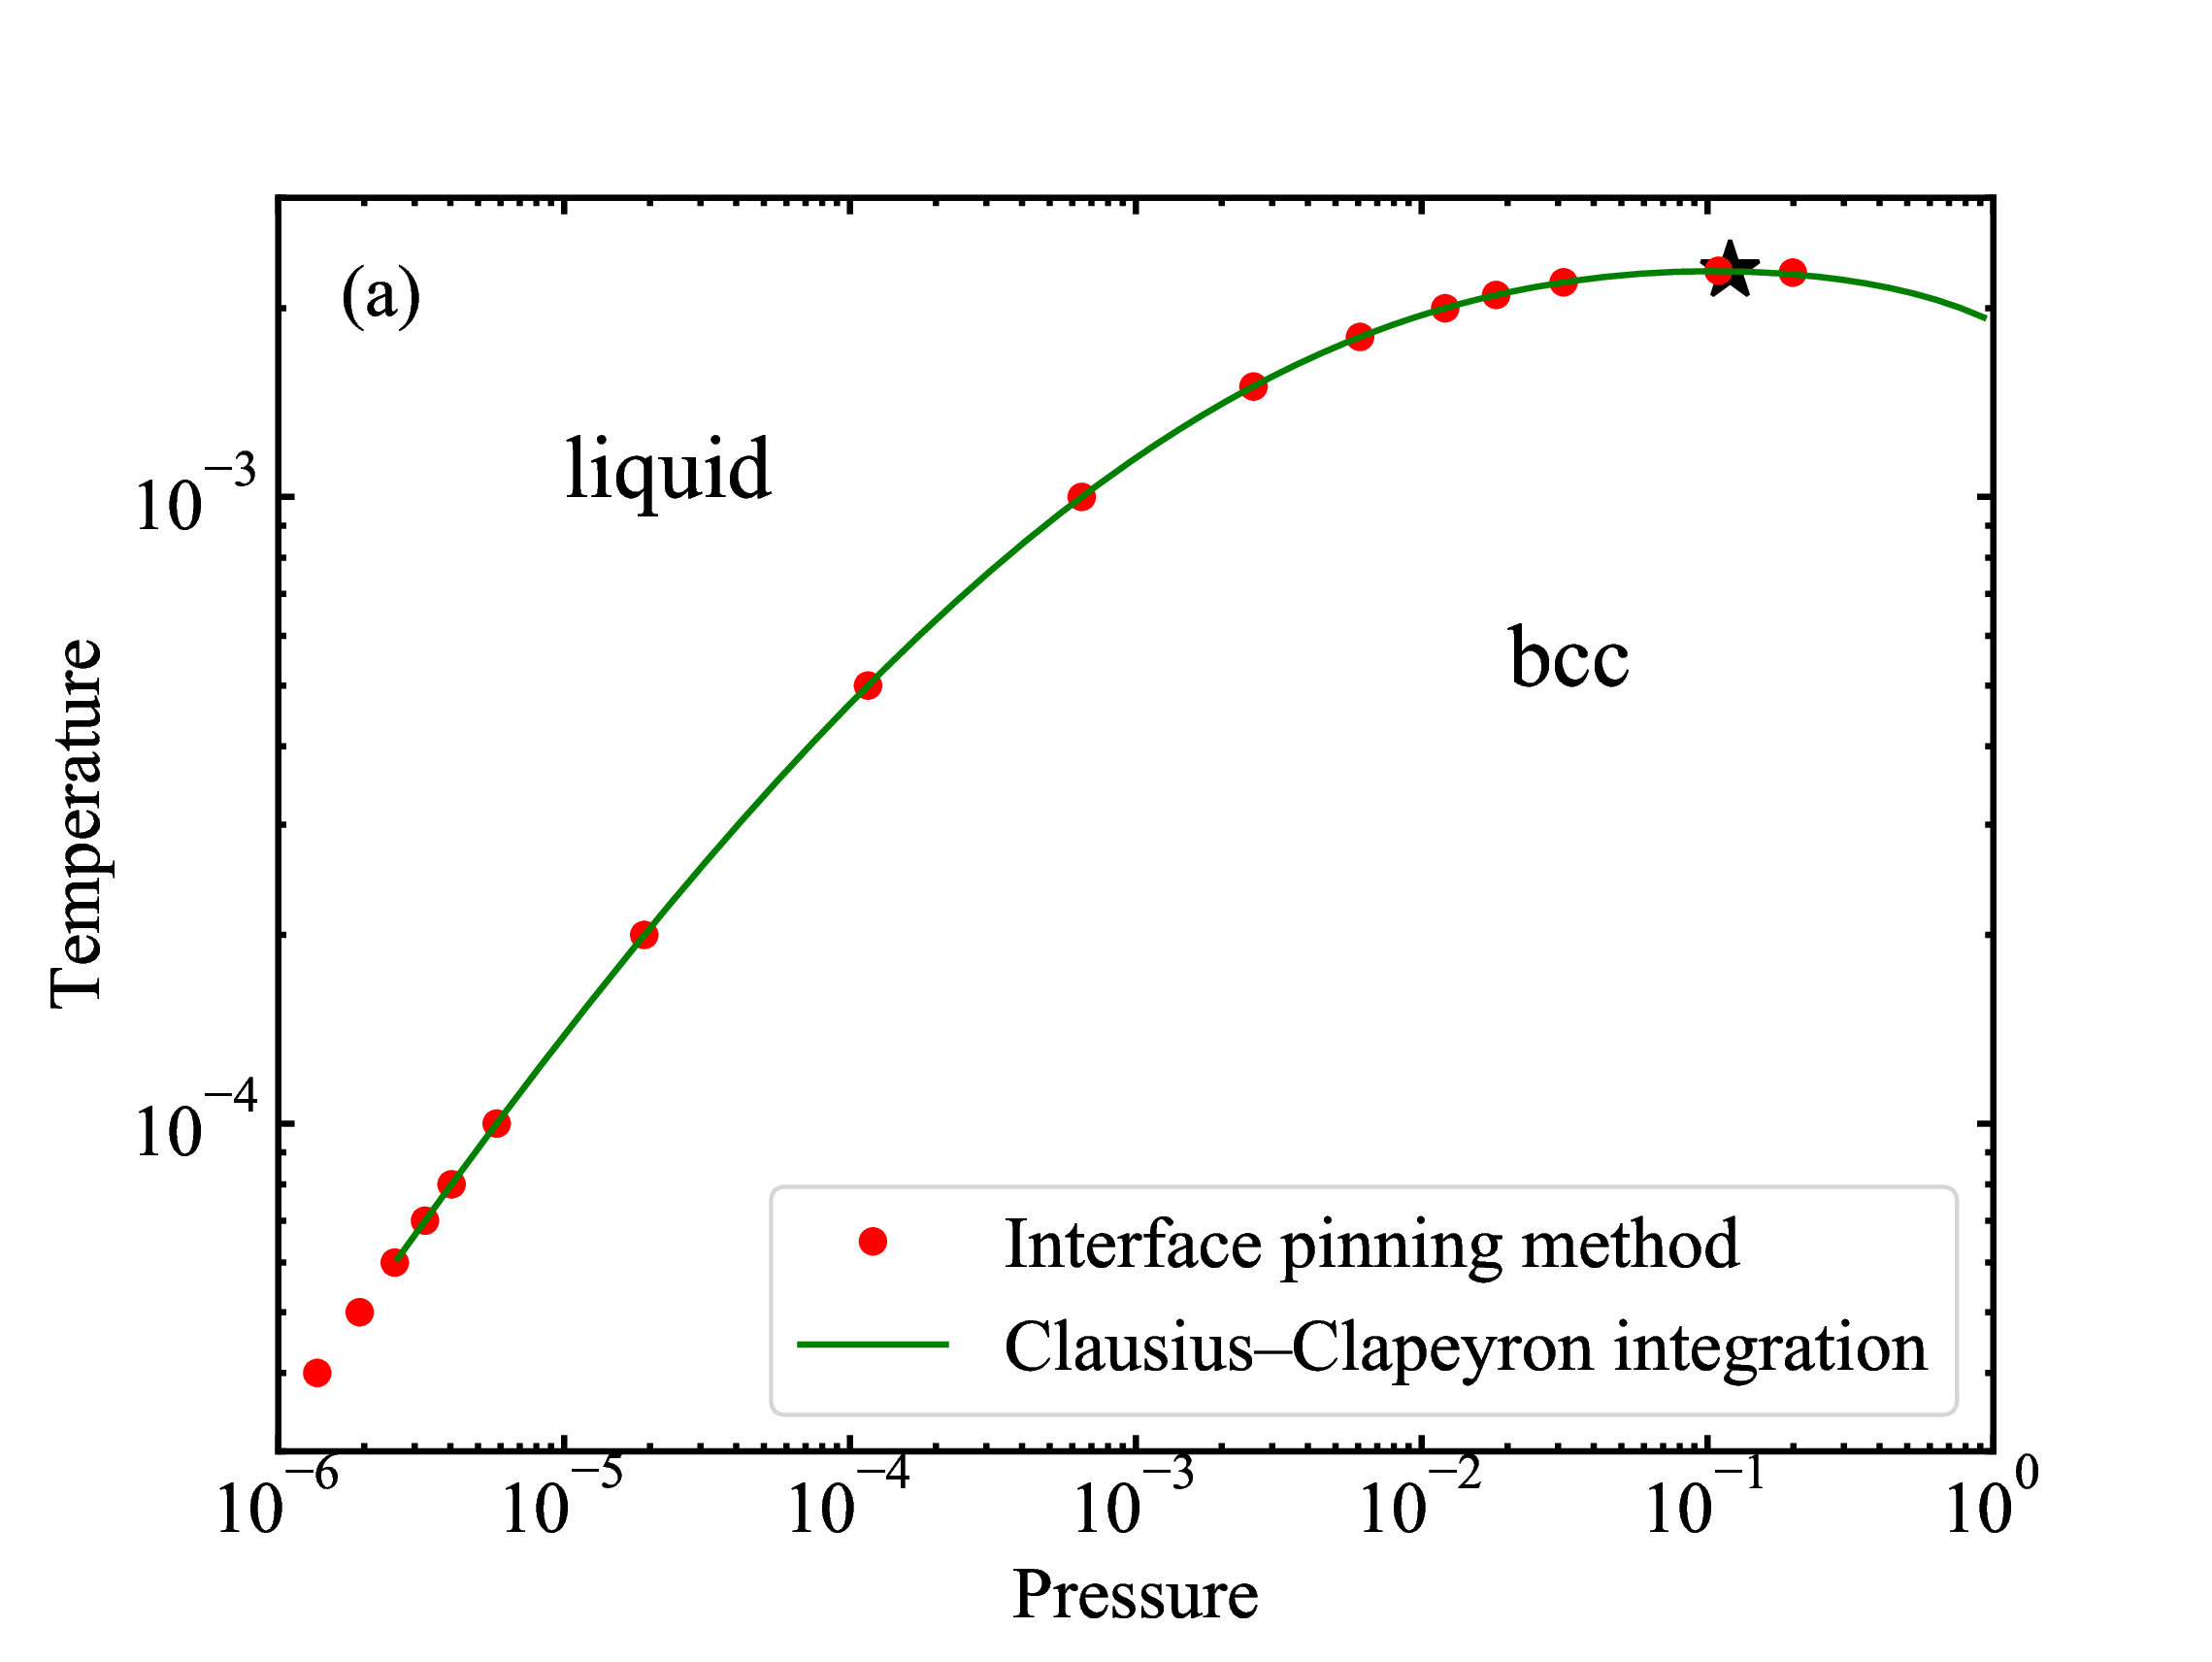
 fig/fig6b.pdf
bcc-liquid coexistence line
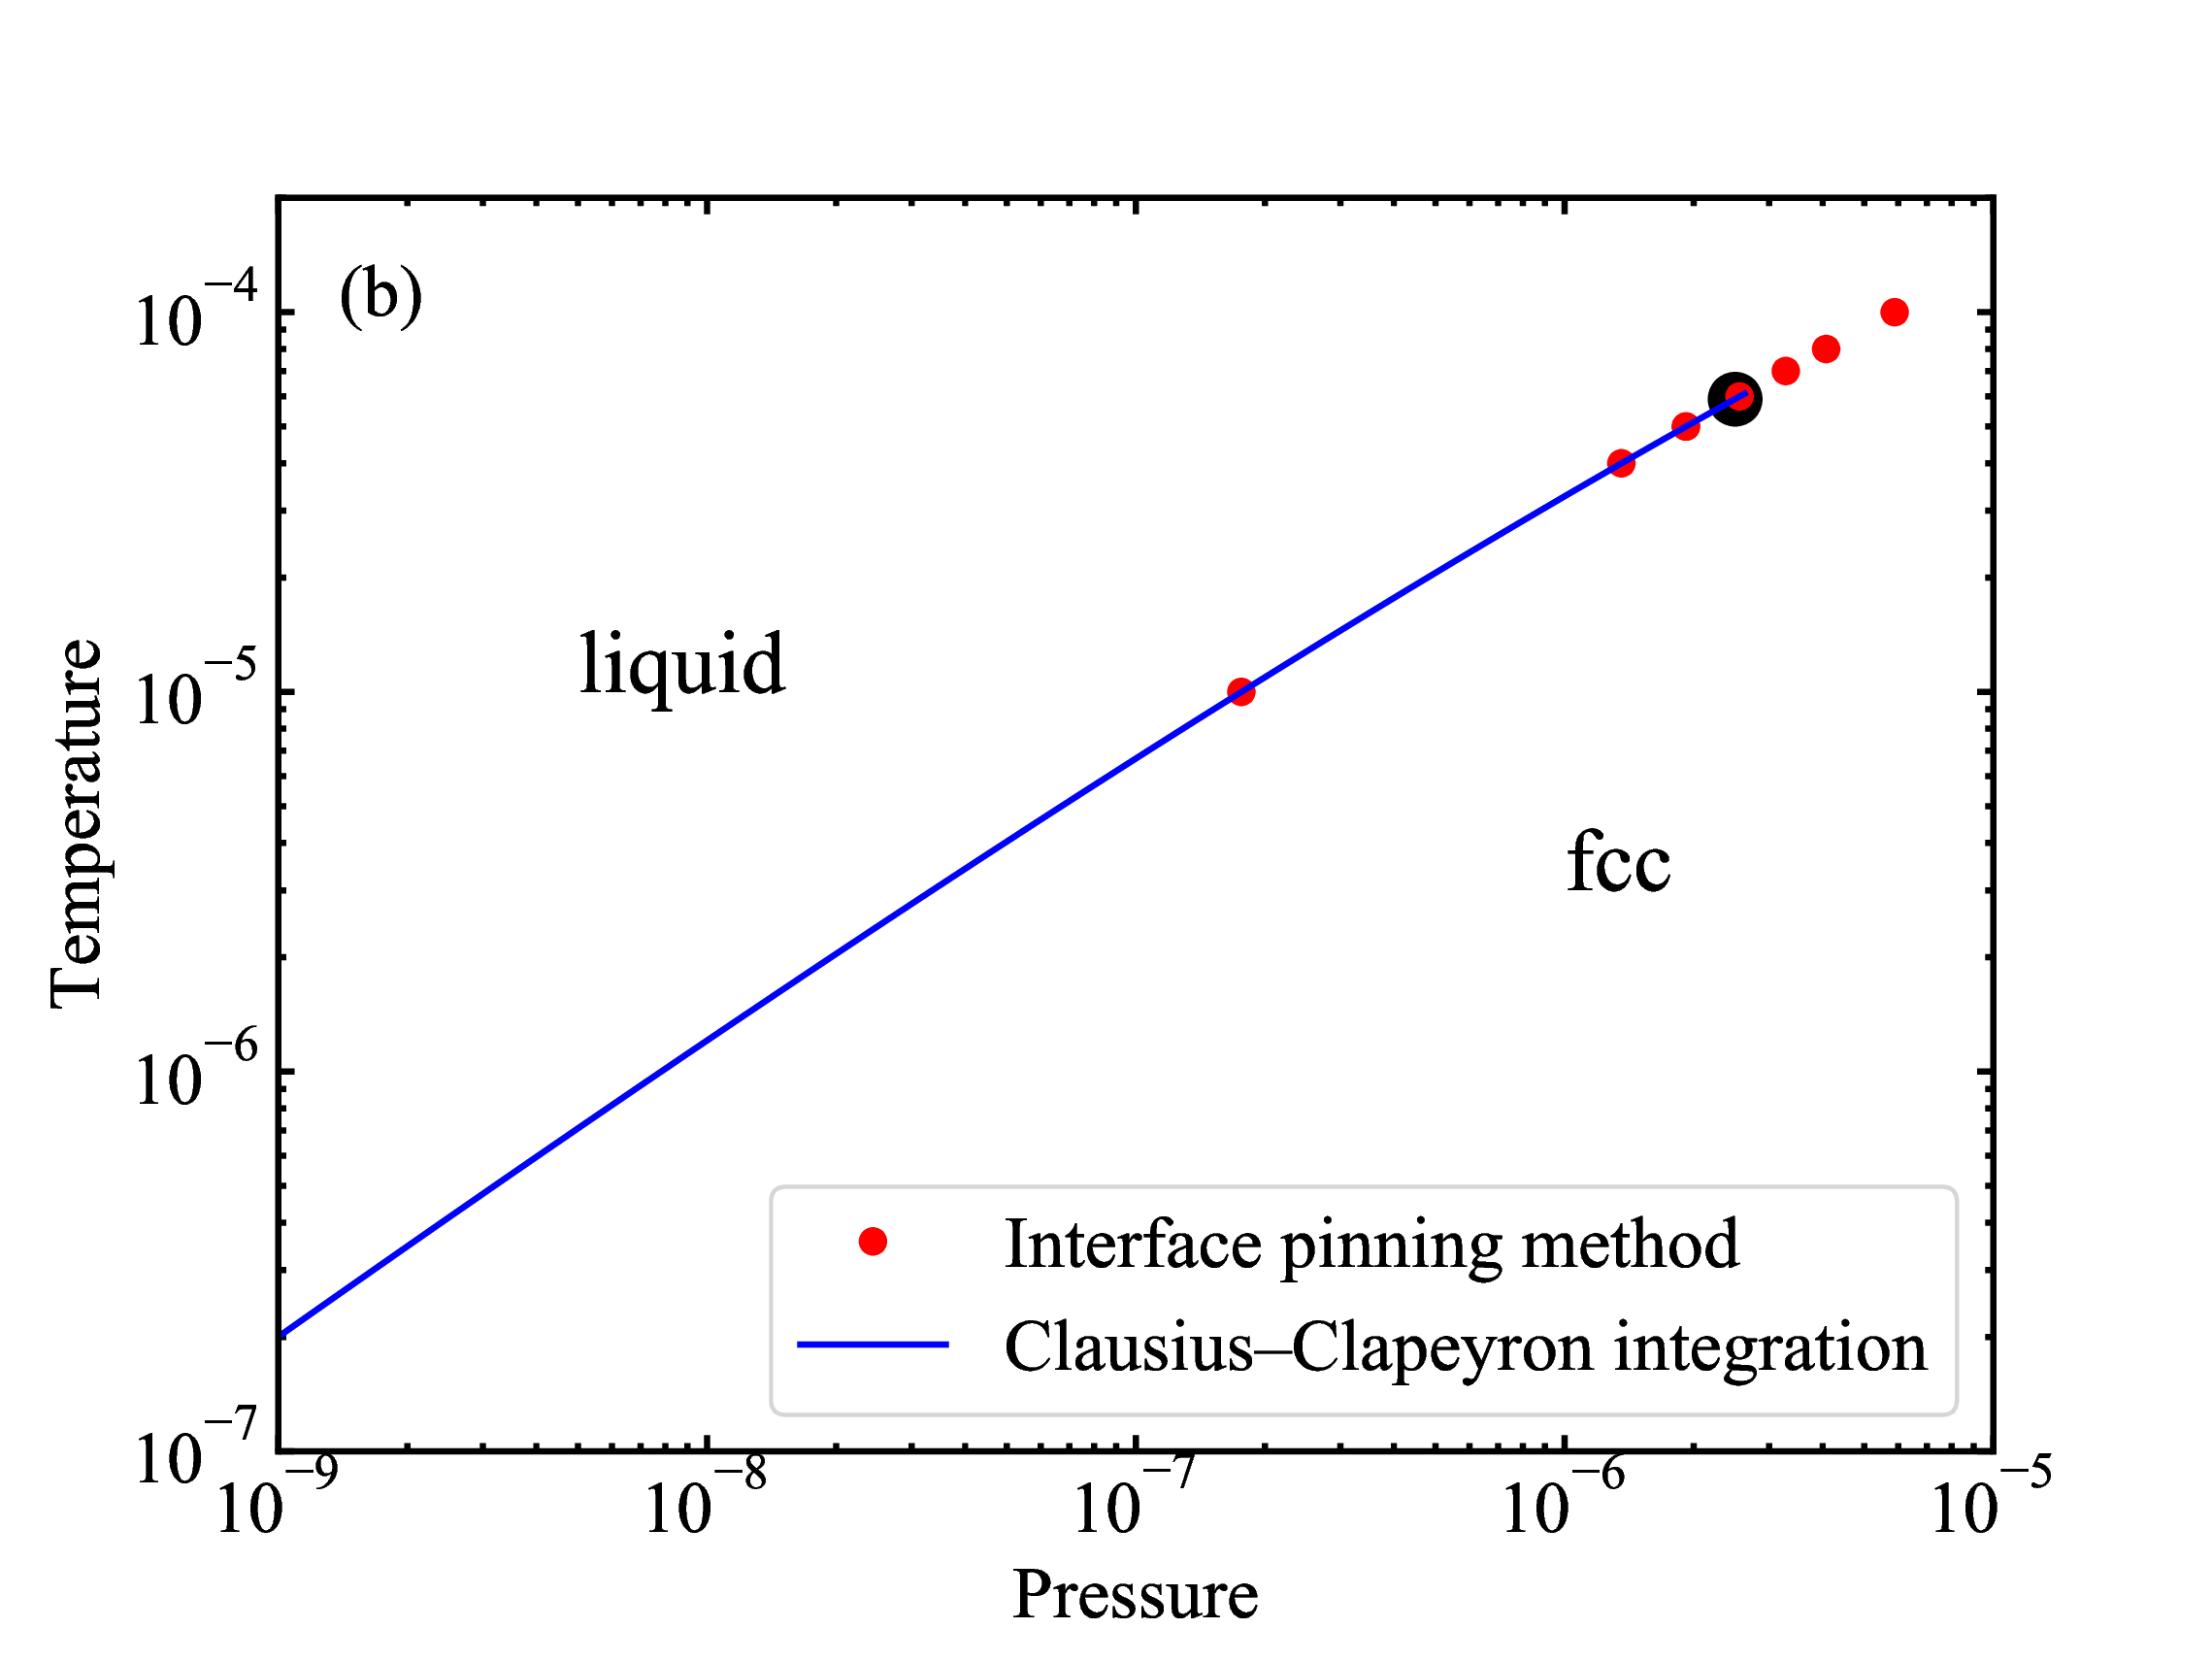
 fig/fig7a.pdf
fcc-liquid coexistence line
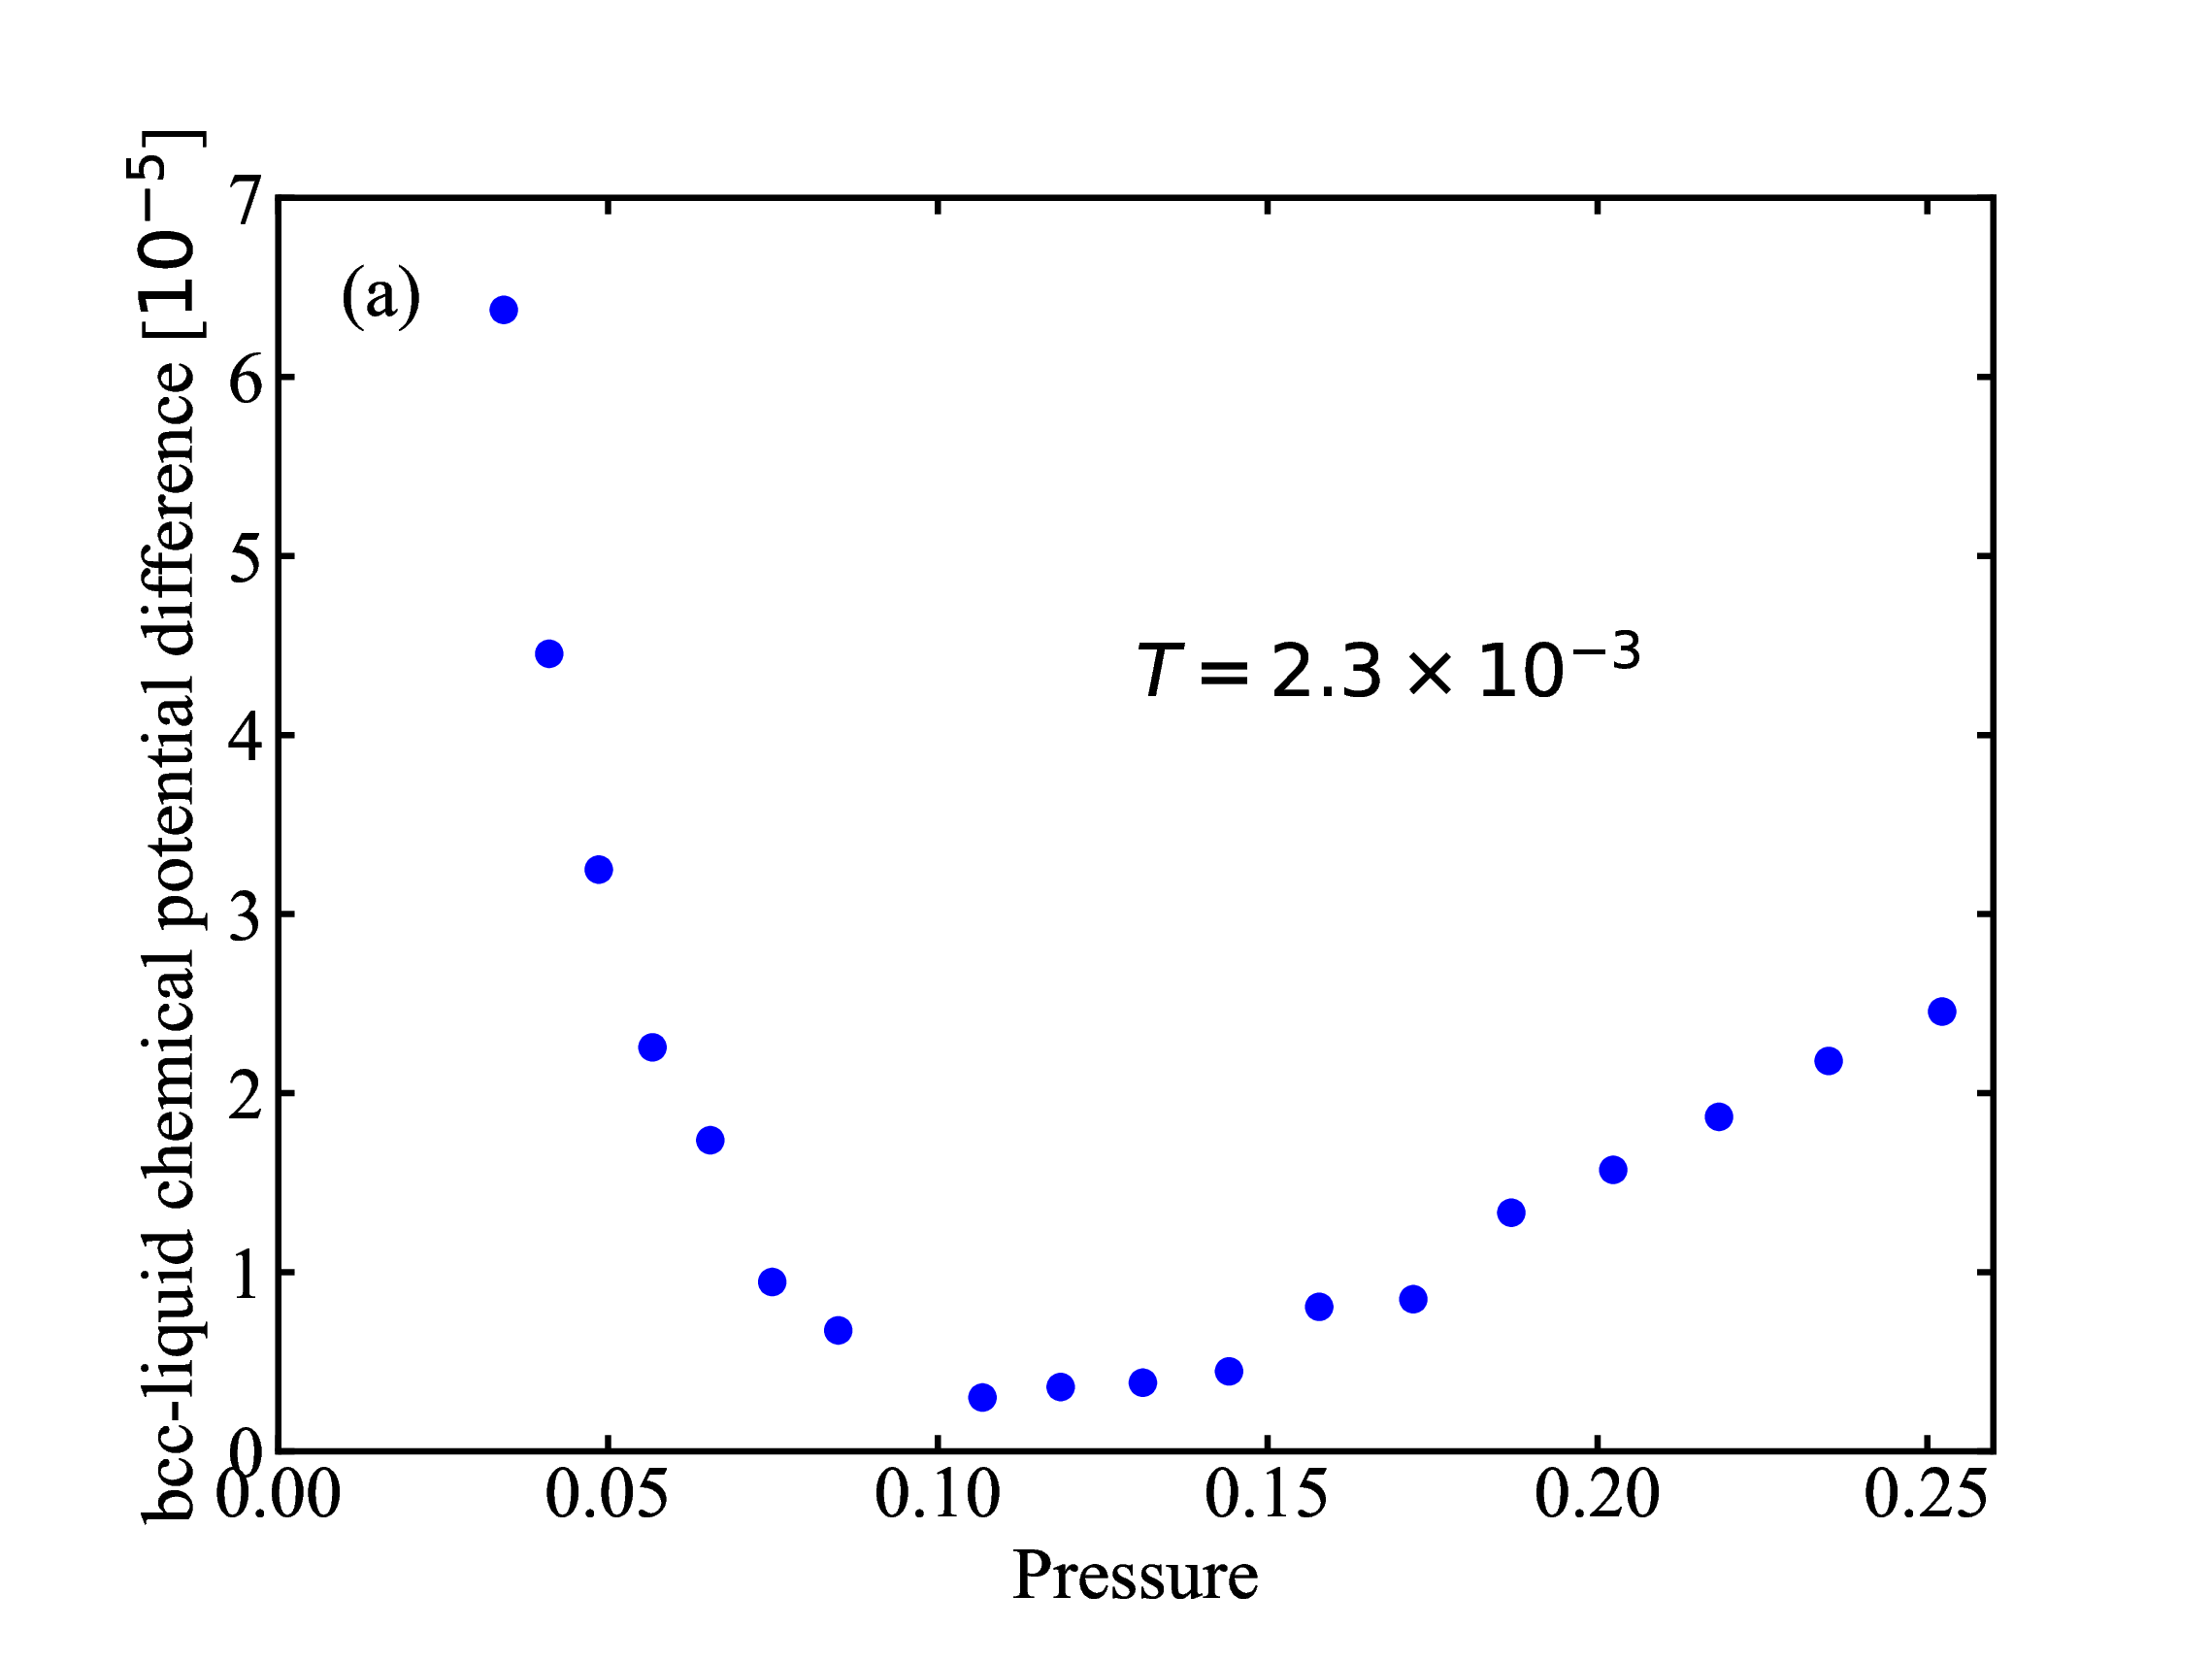
 fig/fig7b.pdf
Difference in chemical potential (liquid and bcc) plotted as a function of pressure along the T = 2.3 × 10⁻³ isotherm
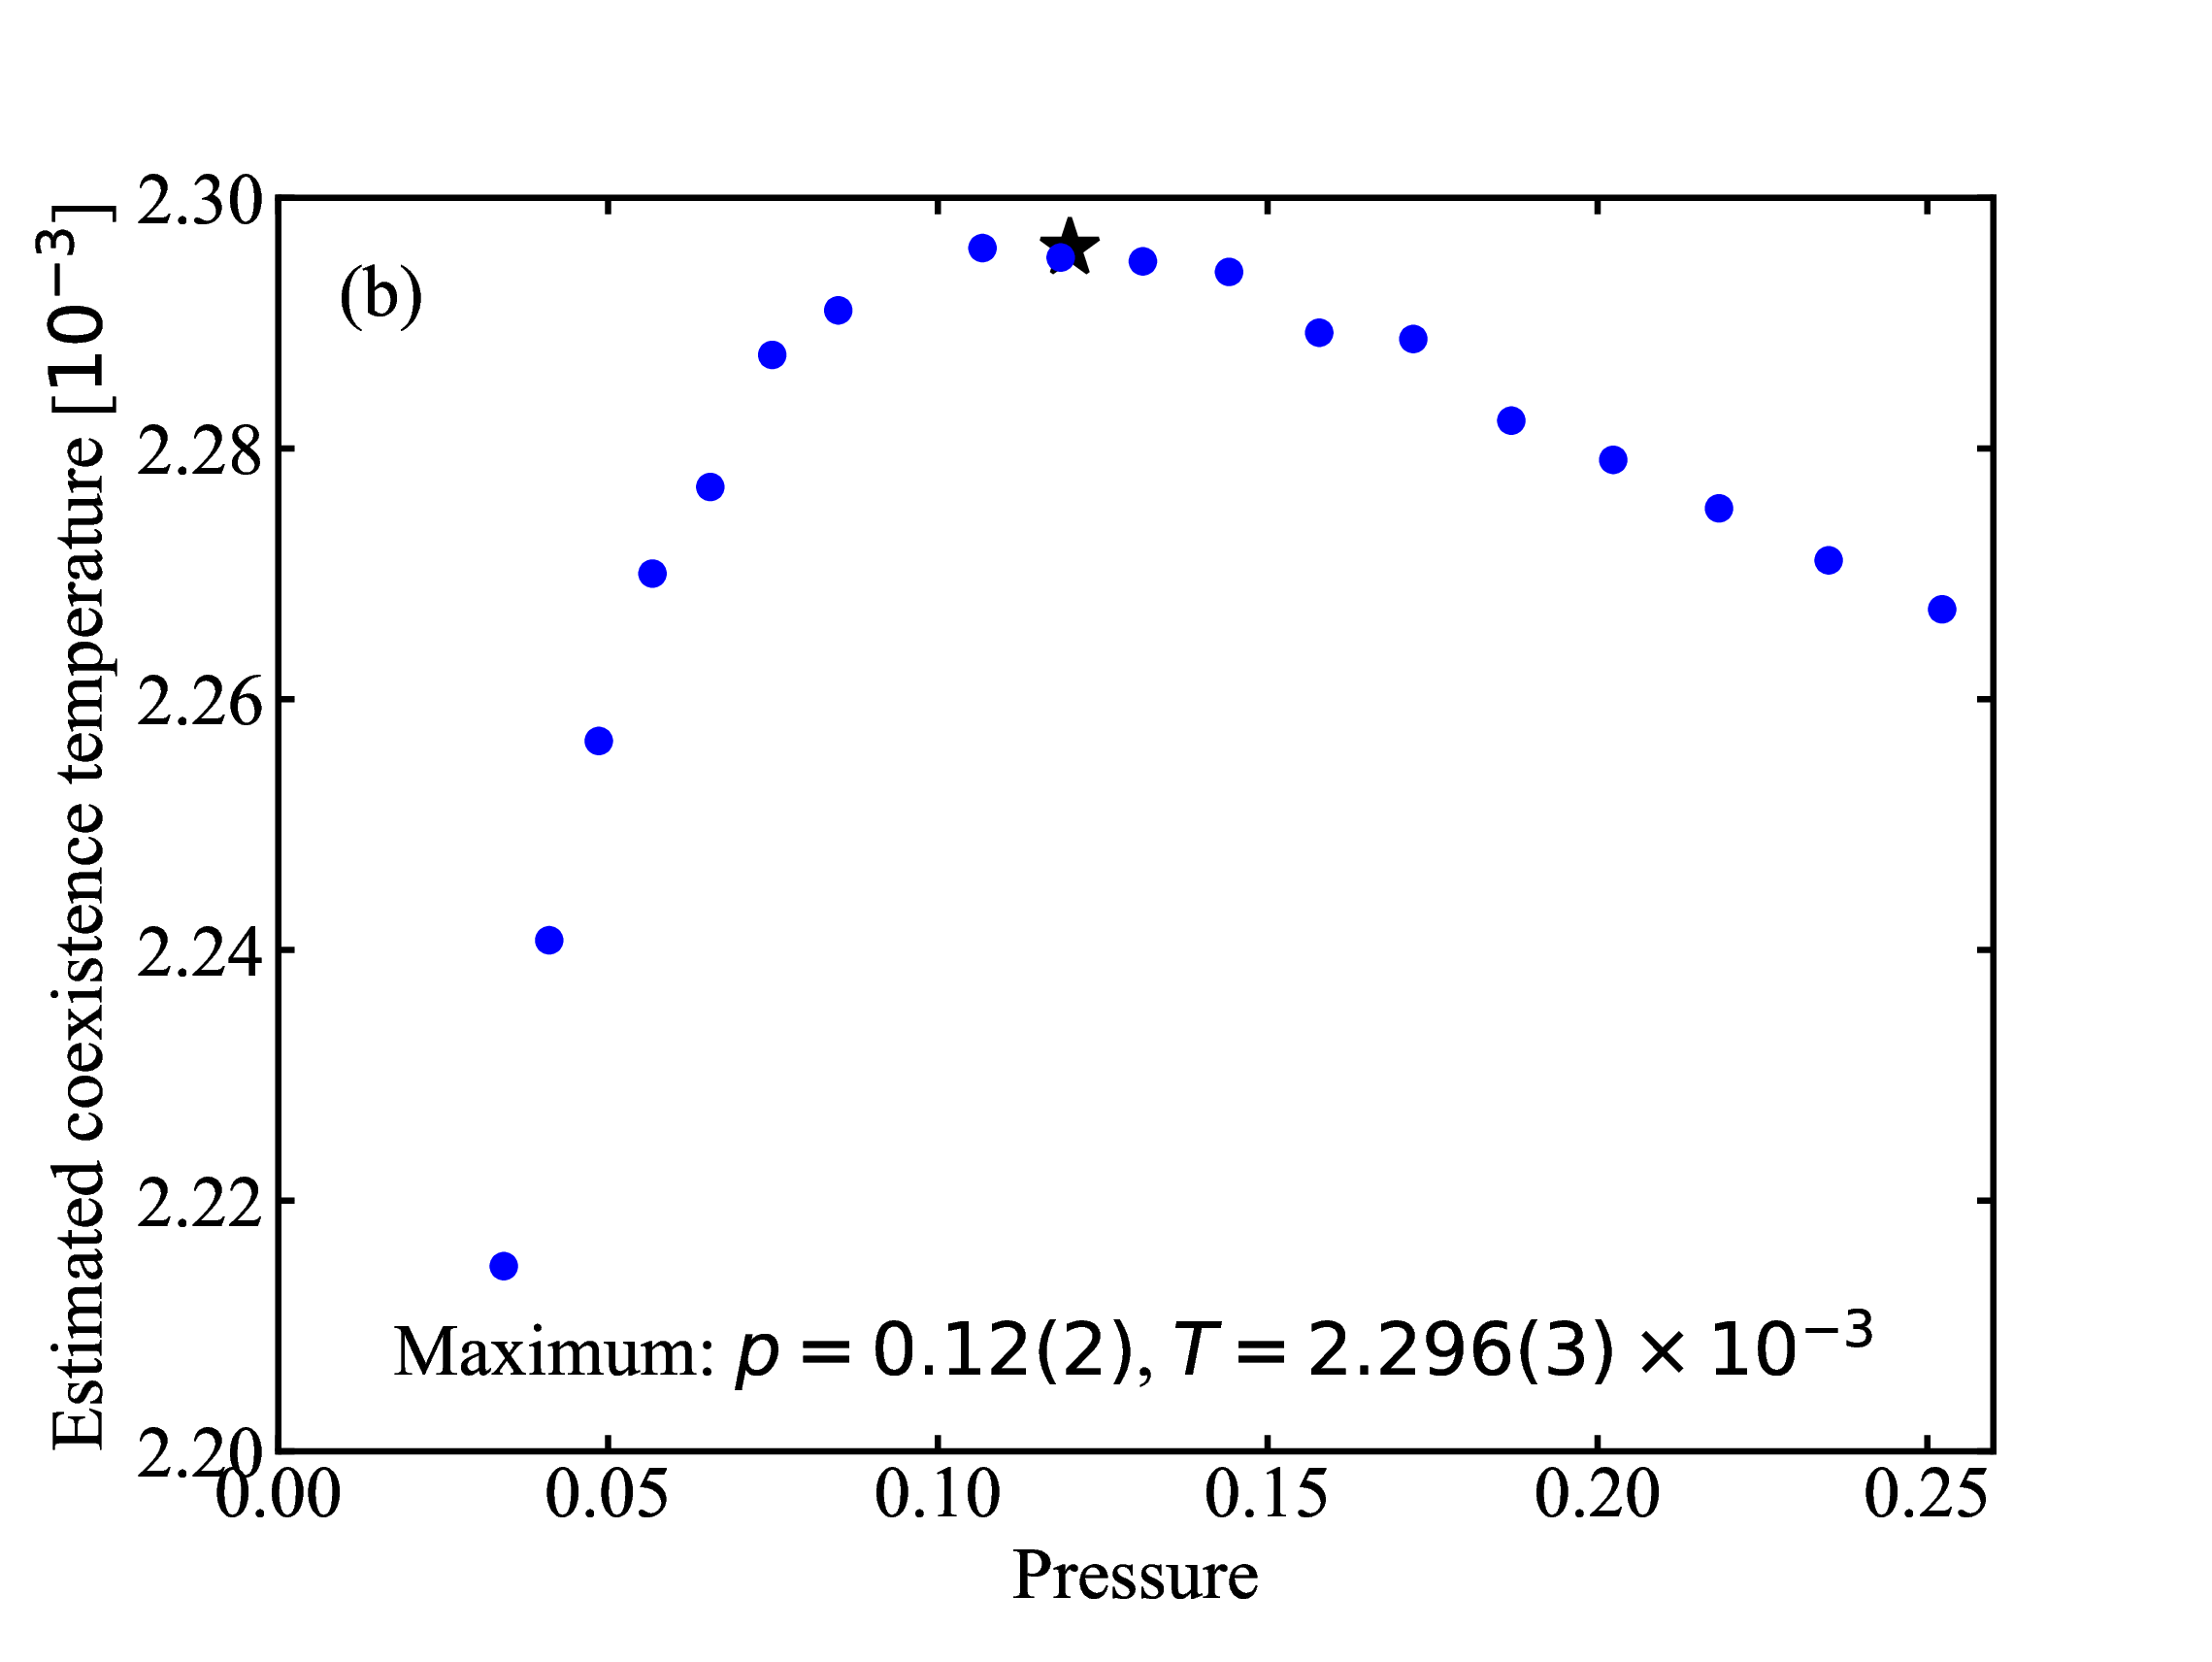
 fig/fig8a.pdf
Estimated coexistence (melting) temperature plotted as a function of pressure
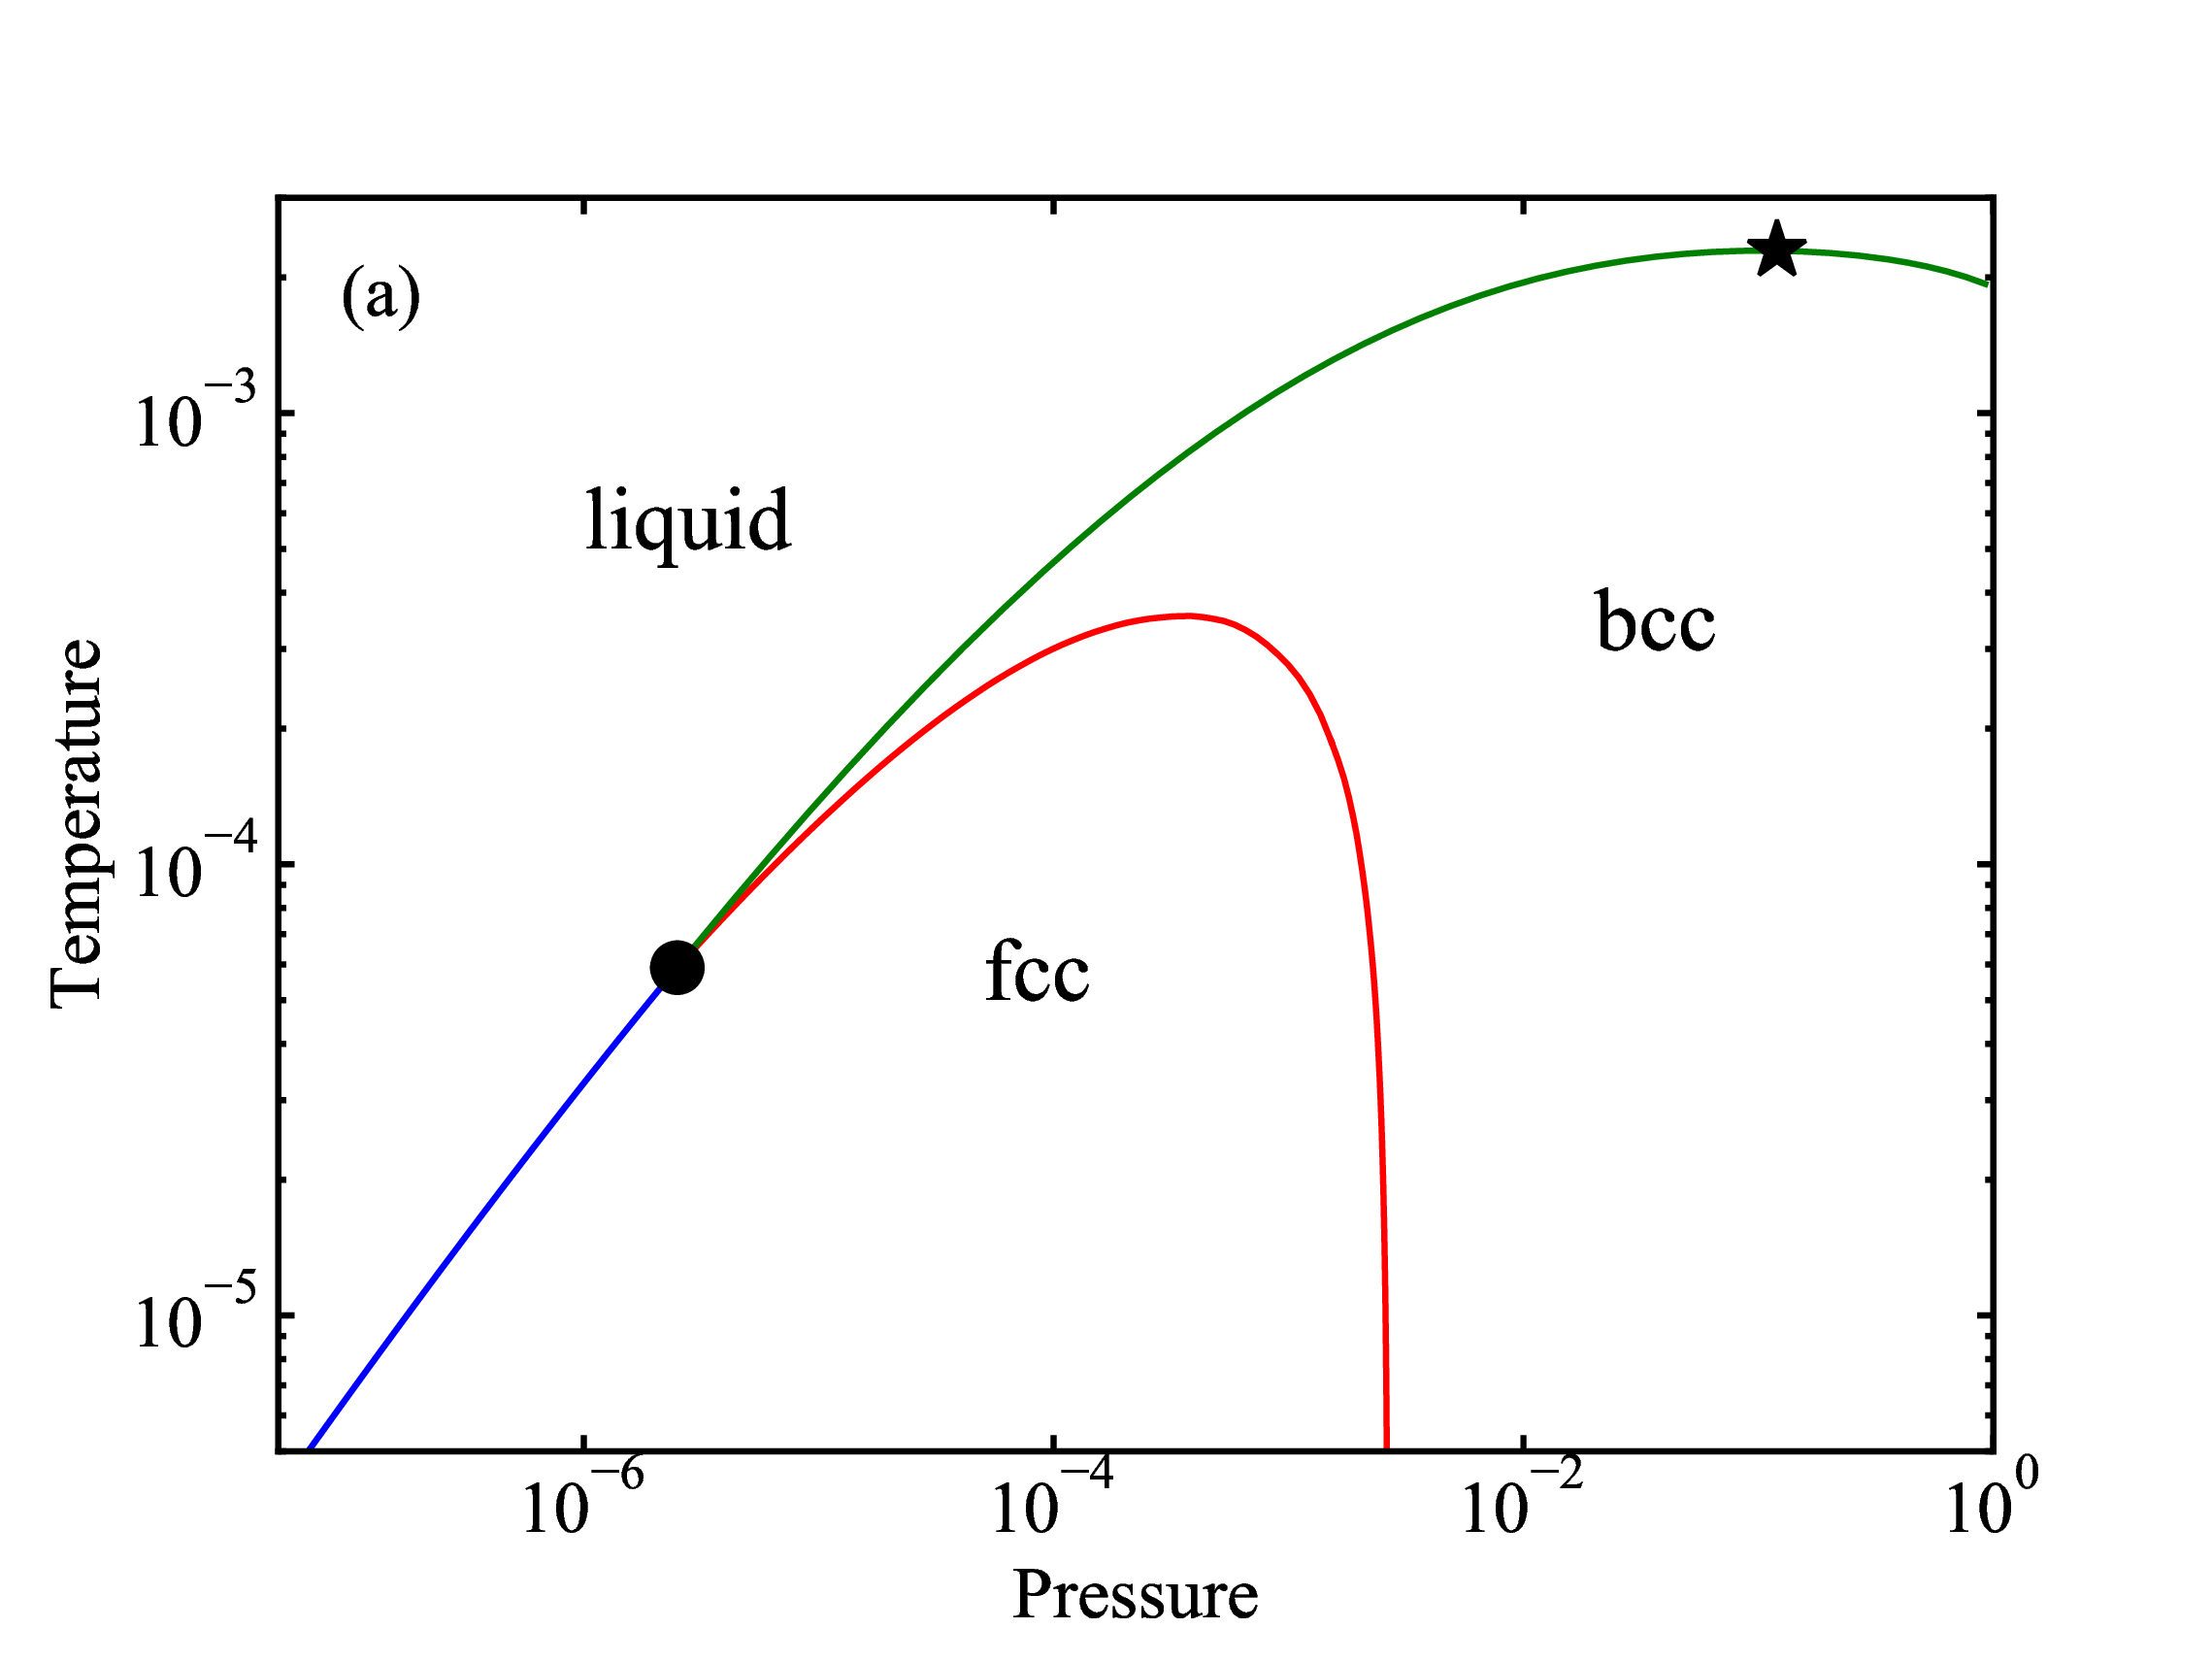
 fig/fig8b.pdf
Pressure-temperature EXP phase diagram
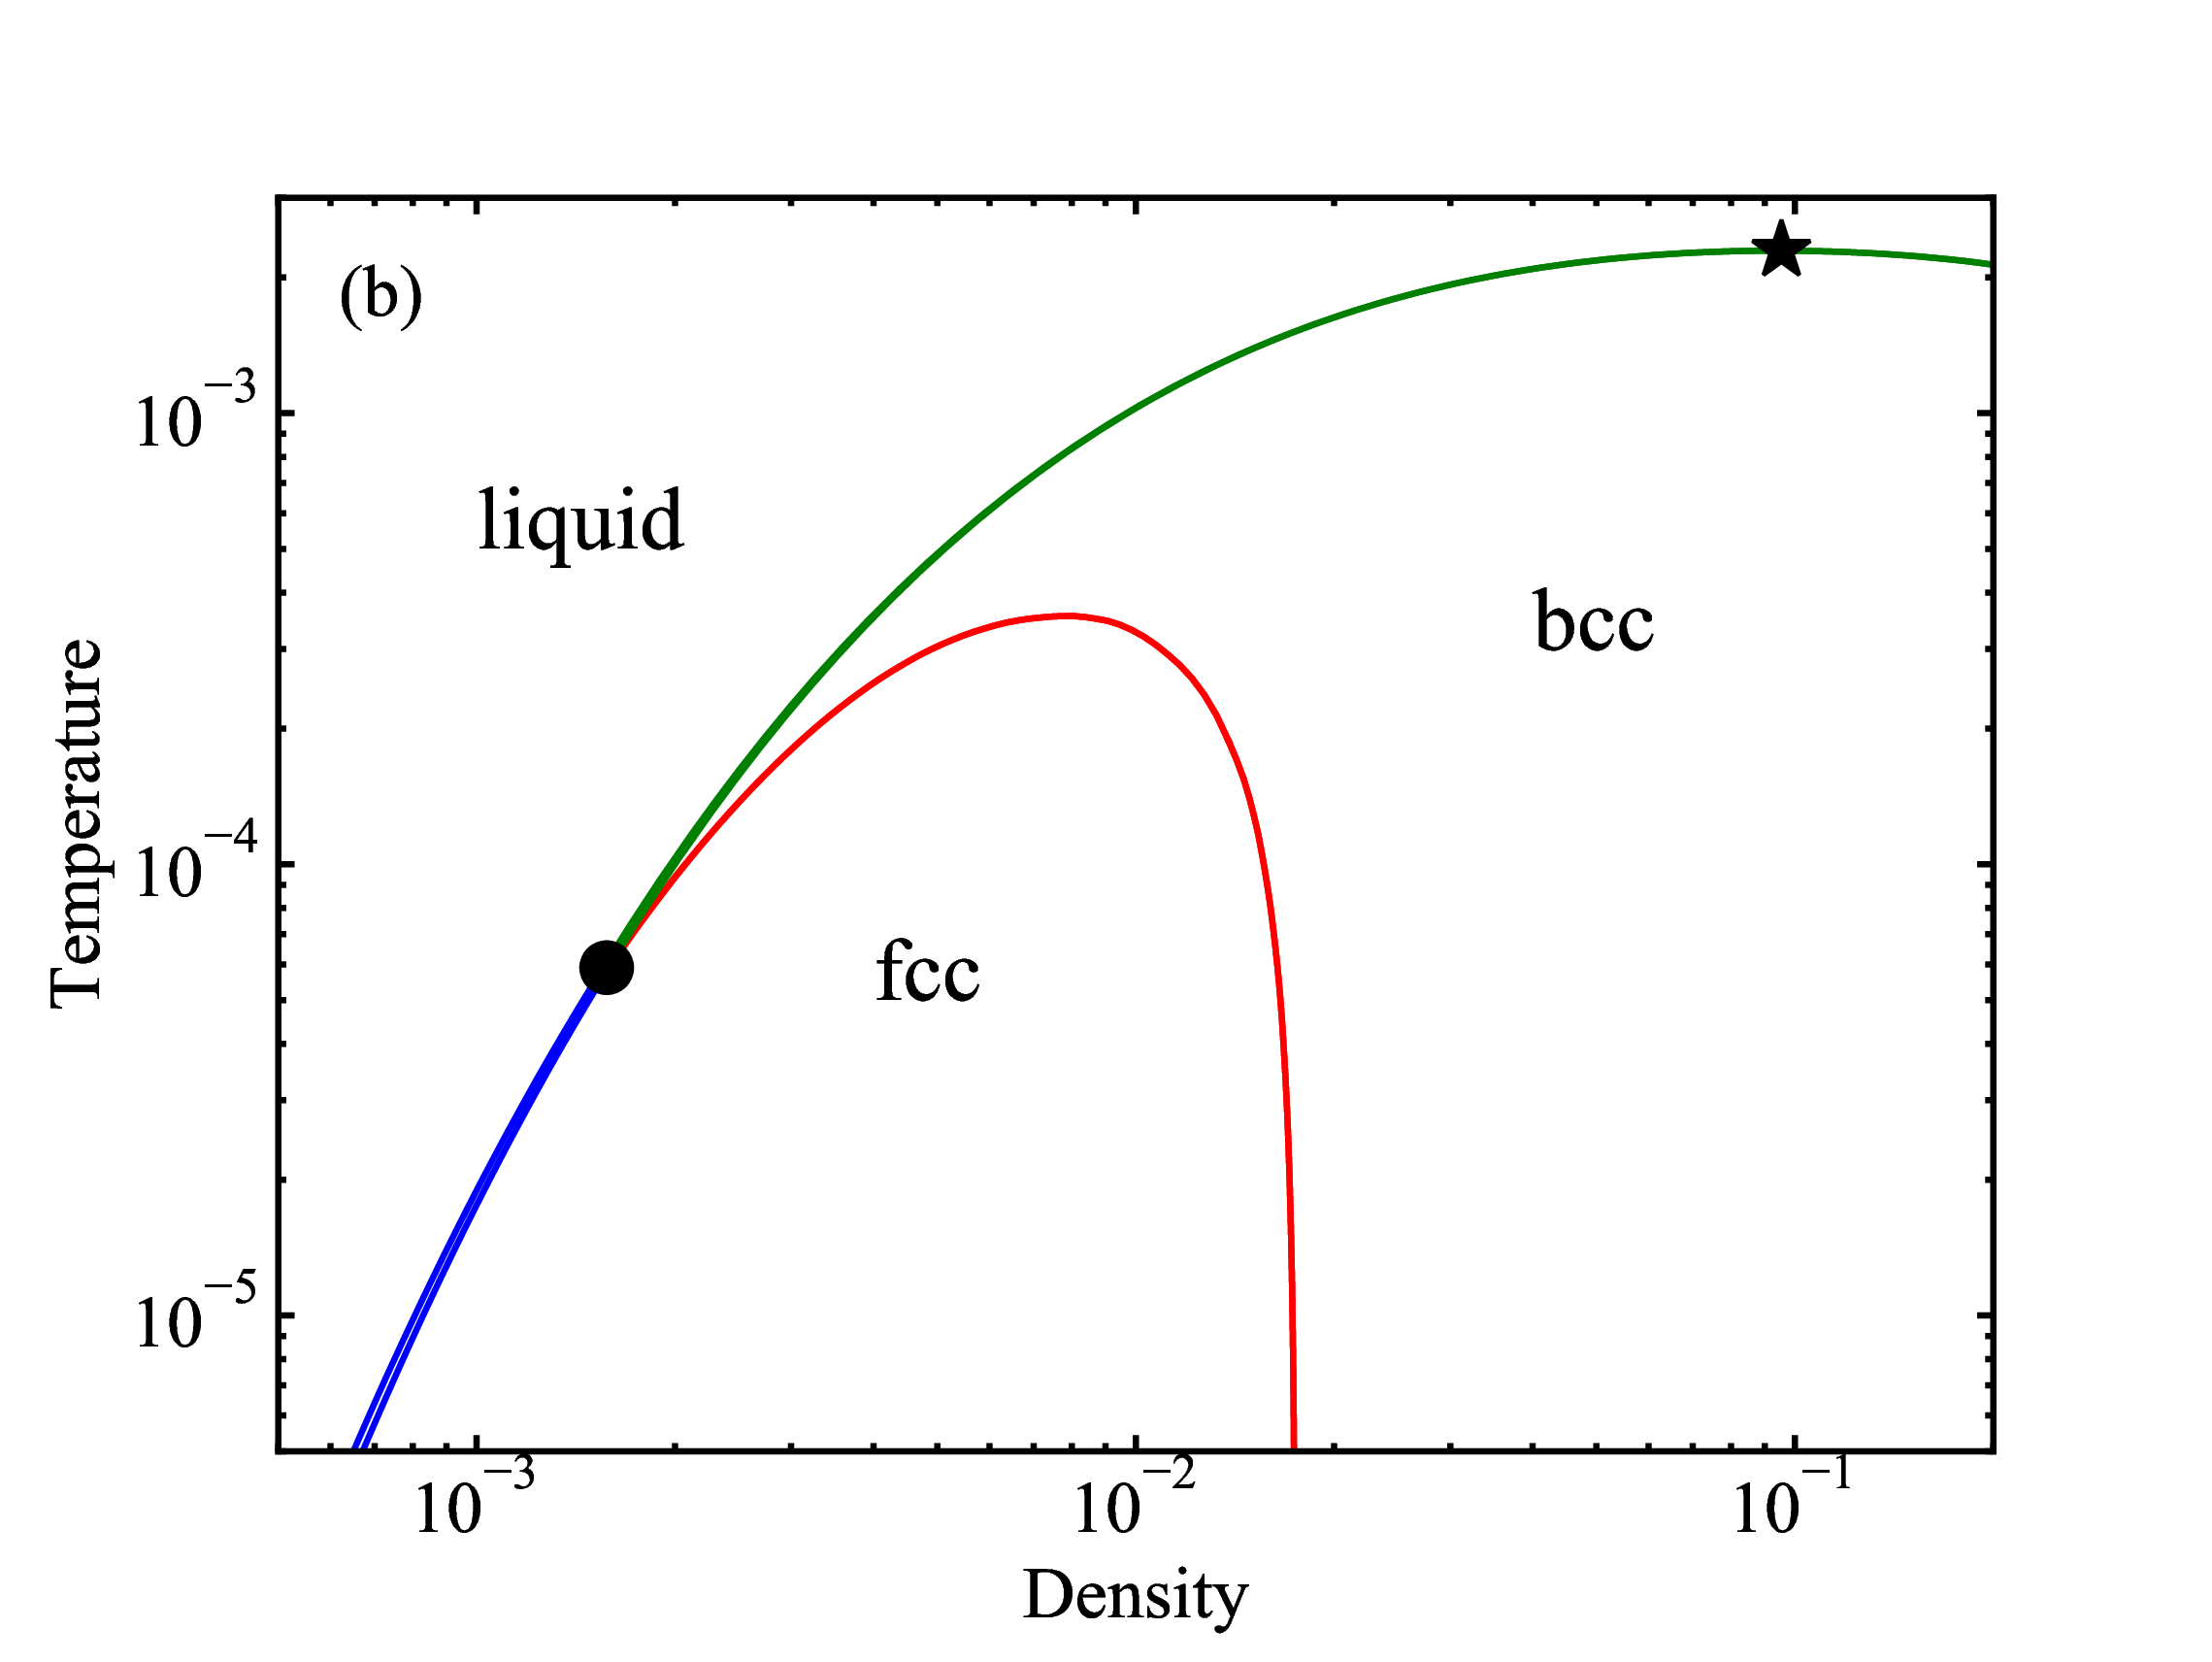
 fig/fig9a.pdf
Density-temperature EXP phase diagram
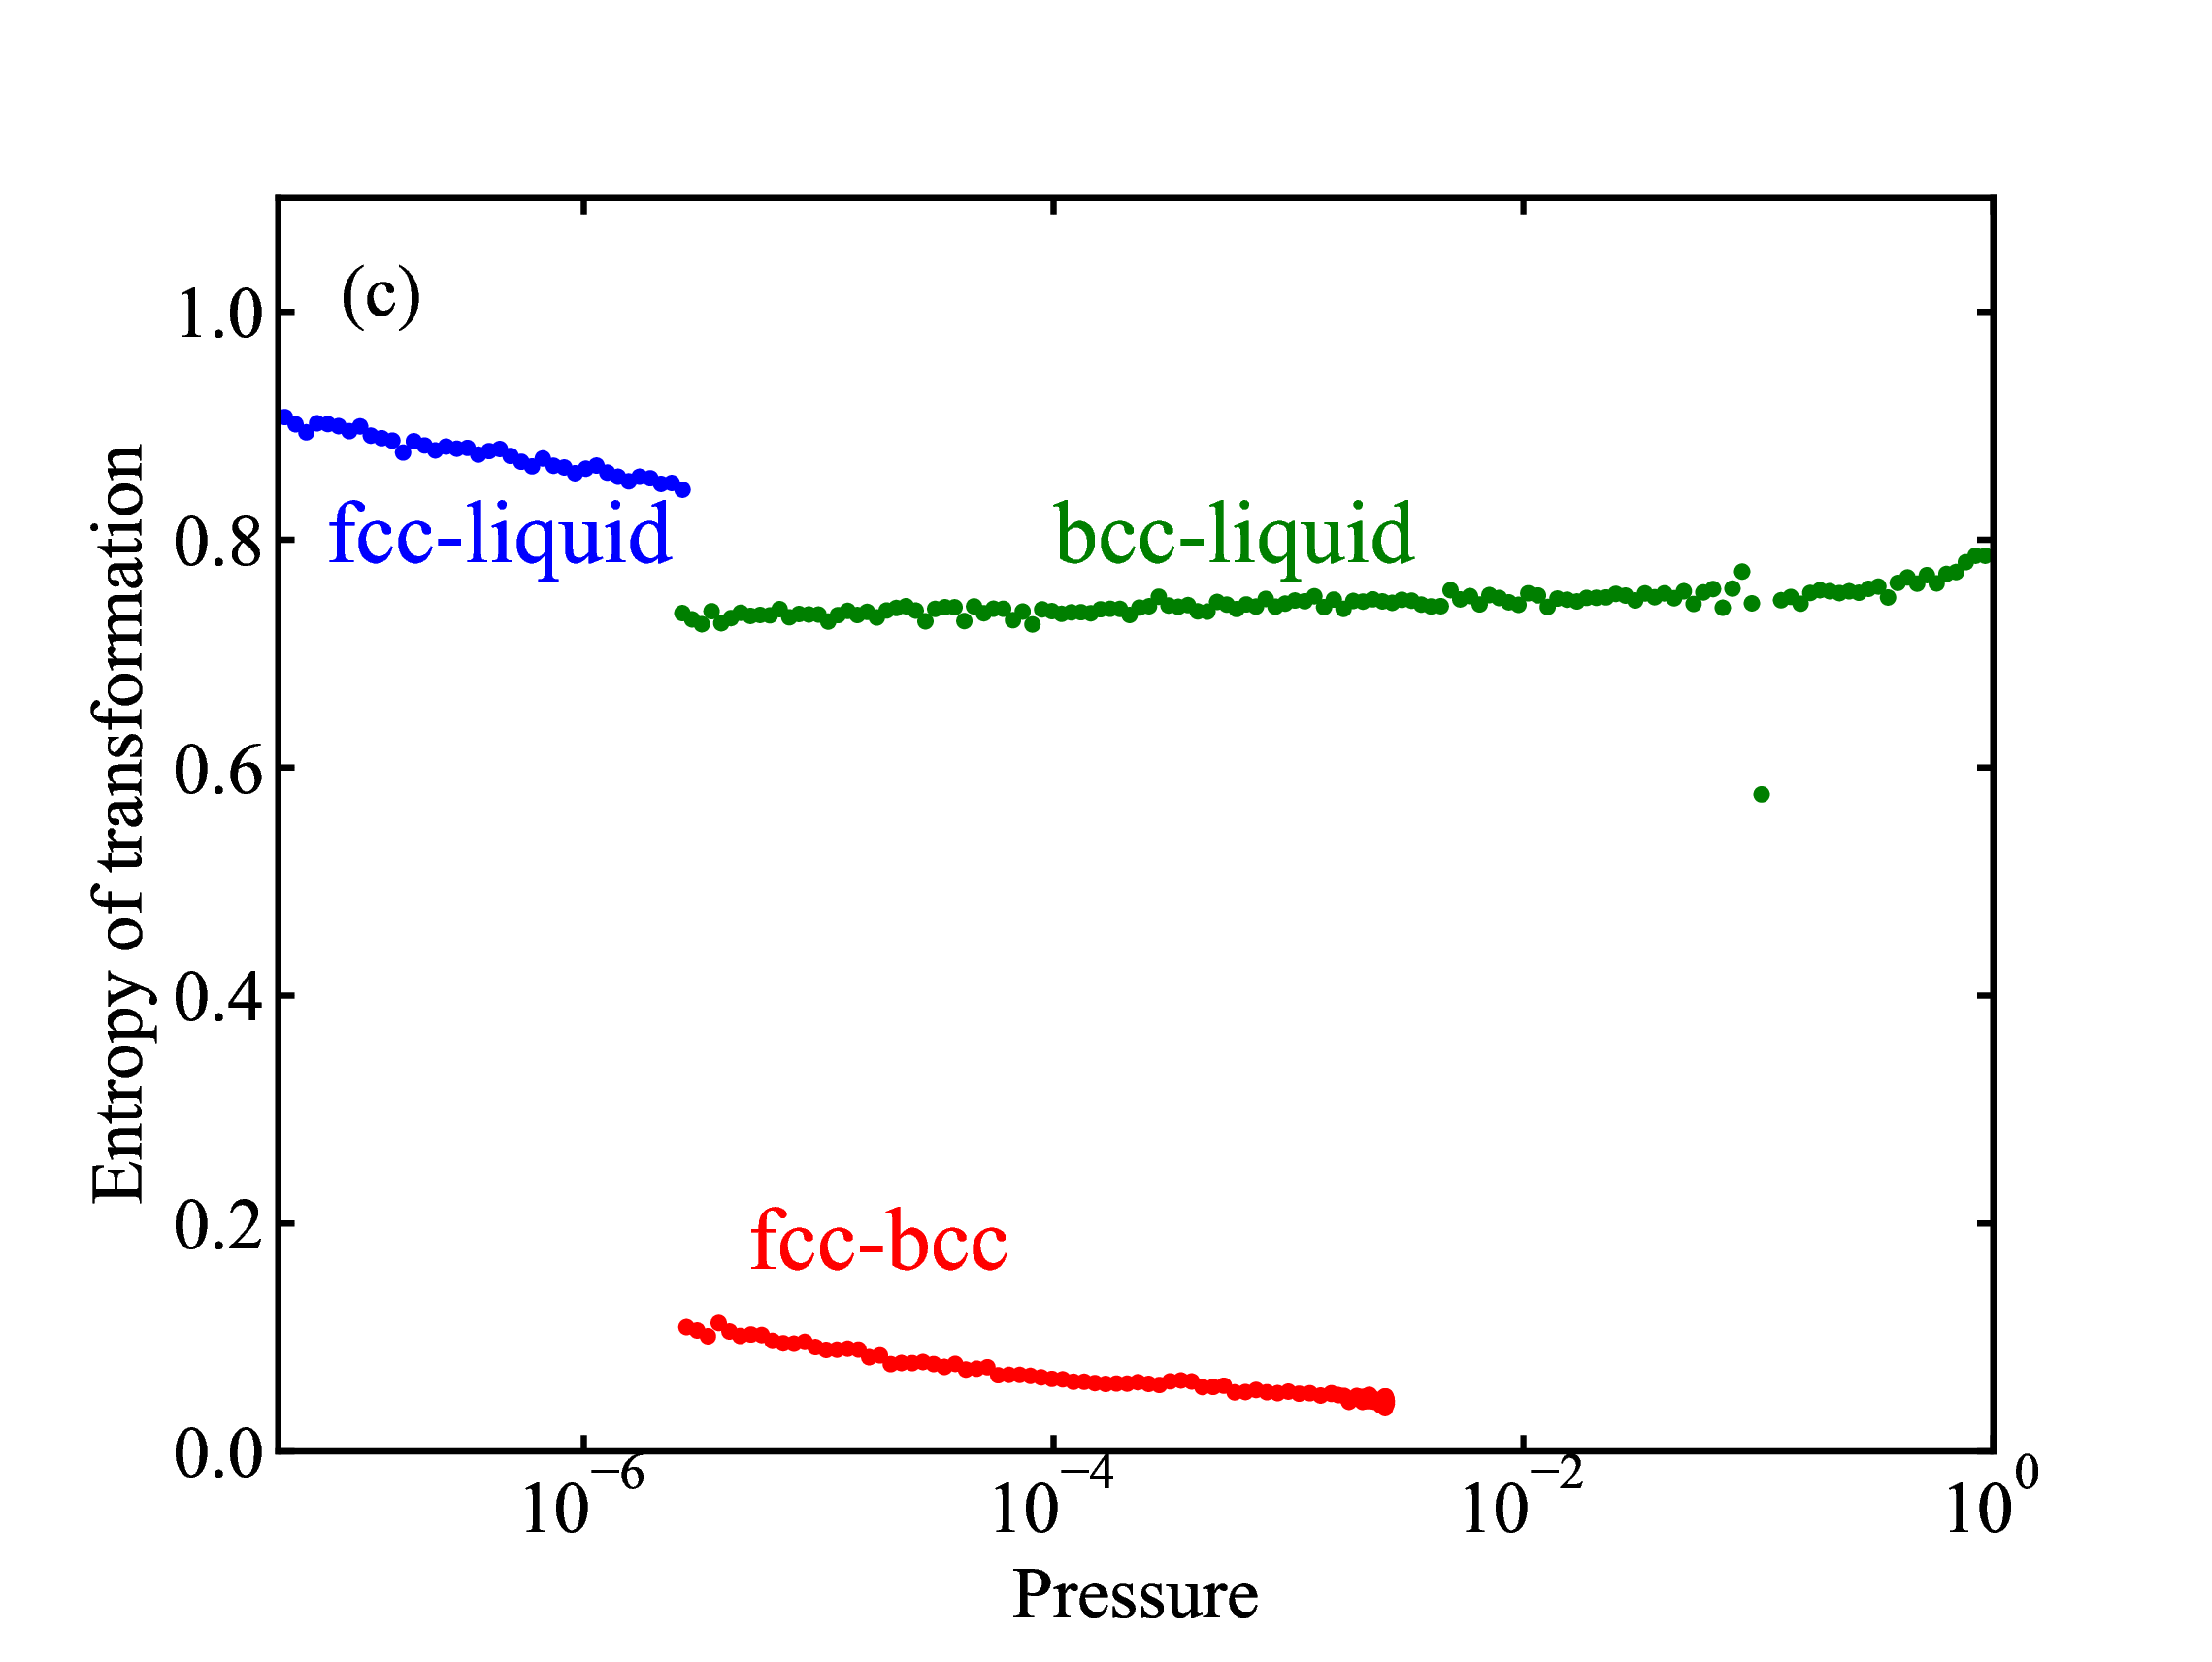
 fig/fig9b.pdf
Phase-change entropy per particle for the fcc-liquid, bcc-liquid, and fcc-bcc transitions plotted as a function of pressure
 fig/fig9c.pdf
Relative density change of the fcc-liquid, bcc-liquid, and fcc-bcc transitions plotted as a function of pressure
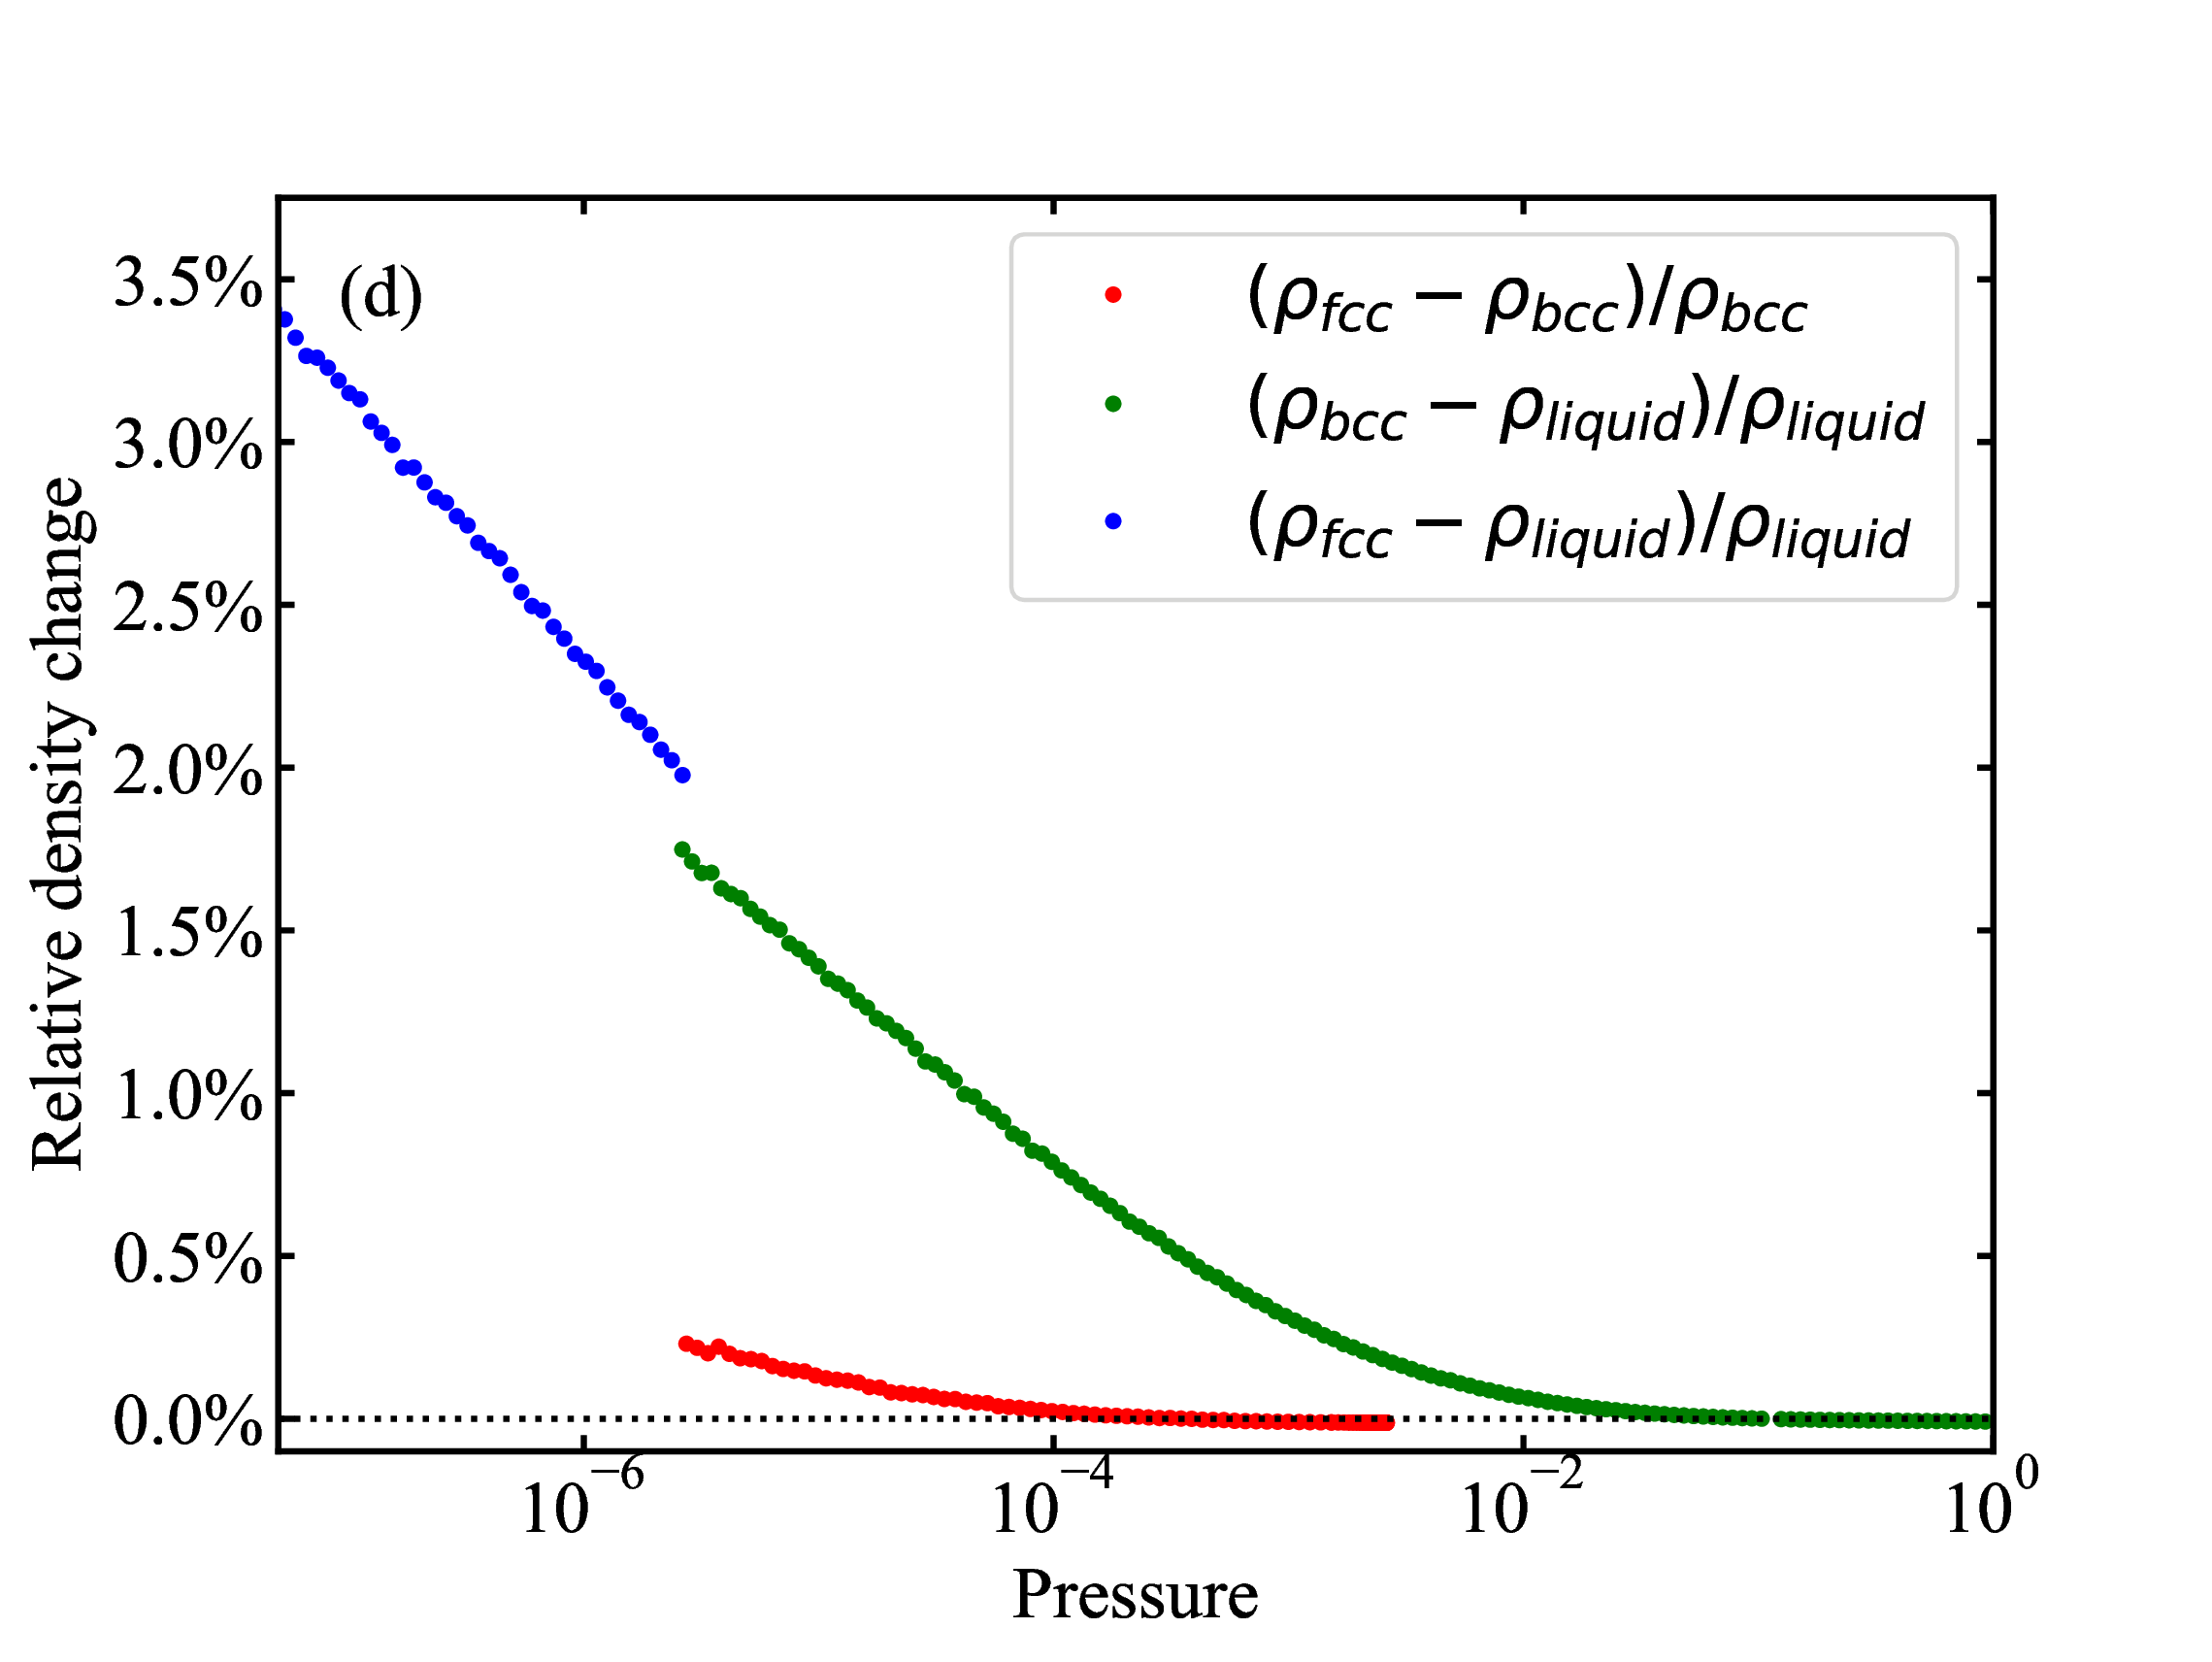 fig/fig9d.pdf